
Baburu Keiki - Is this the Nikkei 1990 moment for the S&P?
Or is it still safe to BTFD?

The Uniqueness of the USA
While I do think consensus sentiment is fairly bleak at the moment and any market rebound will be viewed as a temporary bear market rally by many people, I also see a lot of dip buying advocates whose entire argument essentially rests on extrapolating the past to the future.
The average bear market takes X days!
After a correction of Y%, the next 12 months performance is [insert some obscenely large number]%!
Whatever crisis we had in the past, it eventually resolved and we went back to 8% CAGR afterwards!


Took me 2 minutes to compile the selection of tweets above and I am sure you have seen examples like this, too.
I am always a little bit uneasy when I see this type of reasoning. Since the existence of the S&P 500, the US economic story has been nothing short of a miracle. The 20th century was truly an American one that saw the US quadrupling their population, riding and leading various innovation waves, becoming the world’s dominating economic and military superpower, achieving unchallenged reserve currency status and becoming overall the wealthiest society the world has ever seen. During this time, the stock market drift has been somewhere between 6% and 10% depending on which time frame is deemed most relevant and whether real or nominal return is the preferred metric of choice.
But what if population declines, if there is a lack of innovation (or the index constituents are missing out on it), if economic dynamics worsen, if political competence vanishes? In short, if the future turns out to be massively different in negative way compared to what is discounted today? Will there still be a positive equity risk premium in the long run?
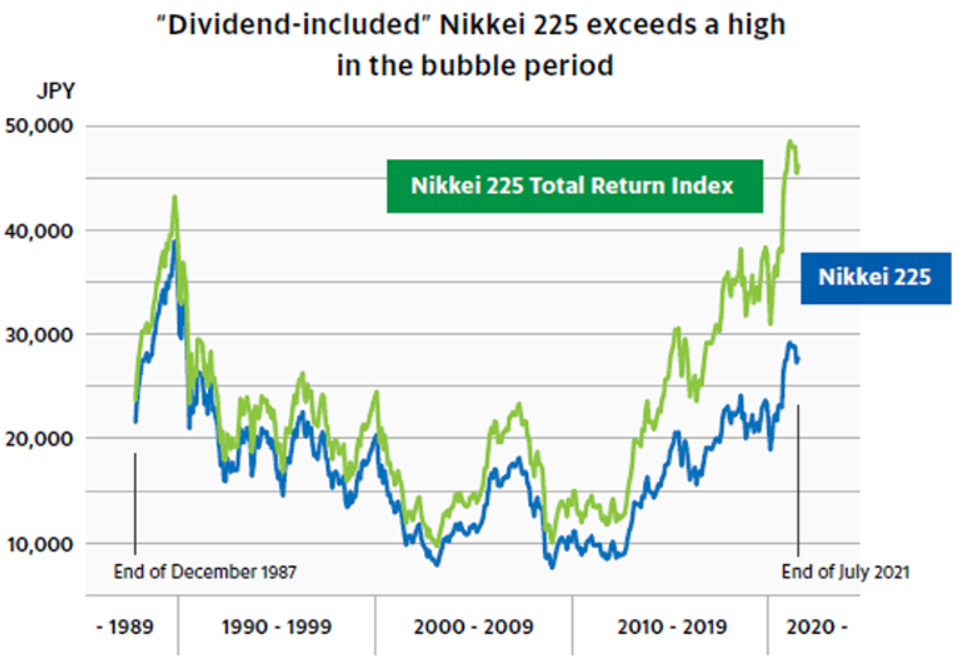
Look at Japan’s Nikkei 225. It took more than 30 years to recover to its 1989 ATH on a total return basis and who knows whether the price index ever makes a new one?
Or look at the German Dax, still battling its 2000 levels, 22 years after the fact. 22 years that have seen an enormous wave of technological progress, most of which German firms have missed out on. You might throw in now: Wait, the Dax is currently flirting with 16,000! Well, that is the Performance Index incl. dividend reinvestment which makes it sort of a scam when compared to most other indices such as the S&P 500, which has almost 3x’ed since 2000 WITHOUT dividends.

I have a pretty good grasp on what is going on in Germany since I have spent most of the first 30 years of my life there. I know about the red tape. The dysfunctionality of the companies. The condescending attitude towards risk takers. Unwillingness to embrace innovation. The critical views on economic growth. The demographic timebomb. The political incompetence. Nothing will ever make me touch Germany-based risk assets such as stock or real estate again.
Japan’s downfall
But Japan has always been a mystery to me. Yes, it shares some of the challenges with Germany. But its downfall has been so monstrous. So never ending. So hopeless. In 1989, they had a global reputation like China has today. It appeared they did everything better than the West. Innovating more, working harder, owning the future. Toyota pioneered lean manufacturing with the Toyota Way. In the 1980s they were what BYD and Tesla want to be today. Sony was a powerhouse co-inventing the CD, the WalkMan, later the PlayStation, predecessors to multi trillion dollar industries today.
And they are still at the forefront today. Panasonic is a key player in battery technology, one of the most important platform technologies for the coming decades where enormous value will be created.
From my previous posts you may remember that I like to compare nominal index performance with money supply growth.
Based on this, look at this incredible chart below and how the gap between Nikkei and money supply has opened since 1989.

If the Nikkei had grown alongside JPY money supply (like the S&P 500 has followed USD money supply), it would today be at >100,000. Instead it is trading at 26,000! Where did all this money go if it did not prop asset prices? (Answer in next section)
So, whenever the S&P tanks, I think about Japan.
Can it be explained and is it relevant for today?
The impact of currency
The first step to get a grasp on this is to understand that the JPY has appreciated massively over time. In fact you need more than 3x the number of USD to buy the same amount of JPY today vs. 40 years ago, which corresponds to a 2.0% annual appreciation for the Yen on average for more than four decades.

Most of this appreciation originates from Japan’s chronic positive net exports driving Yen demand. To the extent the BoJ allows this appreciation to happen, Japan effectively allows all Yen holders (i.e. mostly domestic savers) to participate in Japan’s economic success on world markets. To the extent, the BoJ tries to neutralize the Yen appreciation by buying FX, actual investors will be advantaged vs. currency owners who will suffer from the ensuing monetary debasement. The latter is what is effectively happening since the 1990s when the BoJ starting keeping the Yen in a trading range against the USD creating an enormous current account balance of cumulatively $4tn since 1996:

If you are confused about the above, the bottom line of all of this is that domestic stock prices can suffer in export oriented economies because of currency appreciation.
Reverting back to the comparison of Nikkei vs. JPY money supply above. All these Yen printed were invested abroad (mostly US treasuries) to prevent the Yen from appreciating due to Japanese exports. Therefore these newly printed Yen were not available to be deployed in the domestic stock market which causes the disconnect between stock performance and money supply growth.
While it may have been beneficial for a domestic Japanese investor to then hold Yen instead of investing it in domestic stocks, we cannot make the same argument for a global investor assessing the S&P.
In my opinion it is therefore a fairer comparison to denominate the Nikkei in USD to compare its performance vs. the S&P. The USD is the global reserve currency and best unit of account for any asset price in my opinion. Let’s take a look how they fared against each other since 1971:

As you can see, by denominating the Nikkei in USD, we are getting closer to the typical stock market drift we are familiar with and in aggregate the US and the Japanese stock market have performed quite similarly over the last four decades. But there is still this massive bump in the chart for Japan in the 1980s that took decades to deflate. It looks very similar to the S&P post 1929. What the heck were Japanese investors thinking when they bought the top in 1989?
The impact of demographics
If you have read the article linked below, you know that the demographic set-up is extremely important for the balance of buying and selling risk assets:
Remember how I defined the age groups 40-54 as High Accumulators (HA) because they are the main buyers of risk assets and 60-69 as High Withdrawers (HW) because they are the main sellers of risk assets? The former group have the highest net savings rate. They are at peak career. Mortgage is paid and kids out of the house. The latter have a low (potentially negative) savings rate and a high asset base to draw from as they enter retirement. They also are the prime candidates looking to swap high risk assets such as stocks to low risk assets such as cash or fixed income products.
And boy, does this explain the 1980s boom and bust well! Look at the chart below:

The Baby Boomers caused the 1990s dotcom bonanza in the US and most other Western countries. But the Japanese Boomers were 10y ahead of the game. Same goes for the Millennials wave who seem to be 10y early compared to the West giving Japan a nice demographic tailwind for the coming five years. In the 2nd half of the 2020s, I would definitely place my bets on North America though.

And by the way what about Europe since we are already at it? Don’t touch it with a 10 foot pole. Can this chart look any worse?

The Bottom Line
The abysmal nominal performance of the Nikkei over the past 40 years is driven by foreign trade dynamics and unfavorable demographics both of which do not pertain to the S&P as of today in a comparable manner.
There may have been some excesses in US stocks in 2021, but nothing comparable to Japan in the 1980s that requires decades to unwind. Instead, we have a favorable demographic set-up coming up. The USD will not appreciate in uncontrolled fashion because the US is not a net exporter of goods and services. There is some appreciation risk associated with the Fed tightening. However, over time this aspect will likely be self-solving as it carries the seeds of disinflation and monetary easing once again.
The Japanese FEDs overintervention, increasingly so, has sapped all the dynamism that economy had.nits pretty sad to see. I hope our US FED doesn't do the same. I disagree with overmanaging and keynesian economic overintervention.
I think this article highlights one of the most important factors driving stock market returns. If their interest in meme stocks and crypto is anything to go by, millenials certainly have a big appetite for risk, which obviously augers well for your thesis. 2022 was also a difficult year for investors and potential pitfalls remain, which hopefully has caused the sentiment reset to negative/risk-off, which usually precedes big upwards moves. Finally, bubbles in the market normally coincide with emergent new technologies. The most recent example of this was the late 90s Internet bubble. I expect a much bigger bubble will be caused by the increased adoption and consumer awareness of a whole host of new technologies, including AI, blockchain, electric and autonomous cars, gene and cell therapy, and cellular agriculture, to name just a few.