Commitment of Traders Report 16Jun23
Derivatives positioning in the most important equity, fixed income, FX and commodity markets
Summary
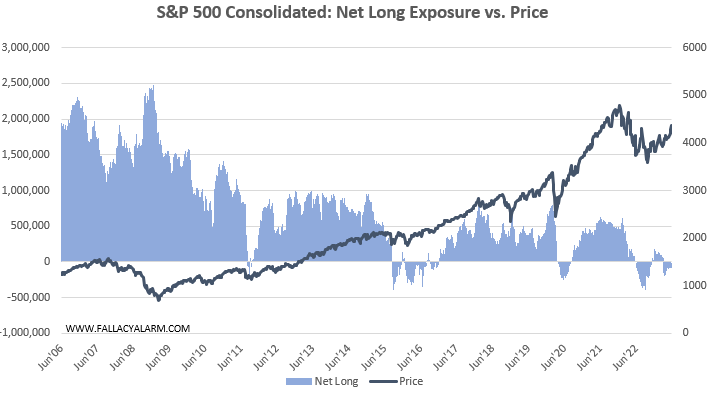
The S&P is up 6% over the past 30 days. A pretty wild rally that caught many off guard. Today’s CoT report confirms that a good amount of it was likely driven by short covering. S&P futures and options traders have cut their net short exposure by $90bn (!) over the past week. They are now pretty much flat. The trigger for this was likely the massive June option expiry that happened today. A lot of ITM short calls had to be closed which caused buying pressure and a decent IV spike.
Where we are headed from here is anyone’s best guess. I believe odds favor a pullback in the near-term, but in the mid/long-term, the bull market remains healthy in my opinion. As outlined in the charts and explanations below, futures and options positioning in US equities and leveraged short volatility bets remain at unambitious levels.
Interestingly, traders are betting quite significantly on falling interest rates which is a signal that my ‘long equities, short bonds’ thesis for 2023 remains on track. Interest in international equity exposure has been rising while commodities are falling out of favor. Bets against the Japanese Yen remain significant, while the Euro is being actively longed (god knows why). Traders have BTFD on Bitcoin, but time will tell how material traditional derivatives trading is for crypto price discovery.
This is a big report. If you are here for the charts only, scroll to the bottom. If you want to understand what I have calculated and why I have done it, read on. :)
Objective
My objective is to come up with an investor/trader positioning report that is as comprehensive, transparent, consistent and insightful as possible.
Comprehensive: Covers the most important asset classes and geographies
Transparent: Absolutely clear what is being measured, how it is being measured and why it has been measured that way.
Consistent: Measuring stick that is constant over time and across asset classes.
Insightful: Maximum signal, minimum noise.
Market participant positioning is an important force for price discovery and I believe there is a lack of transparent and comprehensive information on this matter. Hedgopia is great for example, but in general the landscape is quite fragmented. Some sources are opinion-based and it is uncertain to what extent these opinions are (already) reflected in trades. Others attempt to measure actual positioning, but they do so via surveys and we don’t know the quality and relevance of the source data.
In particular, information on aggregate open interest in options is very limited. Option exposure has become a huge force in price discovery. The OCC regularly reports new clearing records with no end in sight. The problem is that many metrics focus on trading volume which is secondary. I don’t care how many times a contract changes hands. I care about open interest (OI) because that is what matters for leverage hidden in the system. Leveraging up and deleveraging determine the tides of boom and bust in any market.
Methodology
The Commodity Futures Trading Commission (CFTC) is a US derivatives regulator. It governs various derivatives exchanges in the US, most importantly the Chicago Board Options Exchange (CBOE), the Chicago Board of Trade (CBOT) and the Chicago Mercantile Exchange (CME).
Every Friday, the CFTC publishes their weekly Commitments of Traders (COT) Report which provides a breakdown of open interest in various futures and options market segments as of the preceding Tuesday.
My COT Report includes the 18 derivatives markets on various stock market, fixed income, FX and commodity underlyings that I consider most important to get an insightful picture into how institutional investors and traders are positioned.
All charts and explanations herein come for free. For premium subscribers, I have attached my workbook with the entire 2006-2023 raw data on net long exposure and underlying prices. I plan to update this regularly for you. Perhaps not every single week as new insight from that will likely be limited. About once a month feels reasonable in my opinion to stay up to date. We’ll see how it goes and how much traction this gets.
The CFTC’s COT report includes two sections: Financial and Disaggregated. The former group includes stock market and bond market derivatives. The latter includes pretty much anything else, like agricultural products, petroleum and related products, electricity and metals. Both reports are provided as Futures-Only or Futures-and-Options-Combined. I am looking at combined.
Use Case
There are two ways how to interpret positioning information: as a sentiment indicator (to be faded) or an inflection point indicator (to be followed).
Sentiment Indicator: Net long exposure in futures and options often bottoms and peaks at major turning points in the underlying. The underlying hypothesis is that there is a natural sustainable level of investor/trader exposure to which they predictably revert over time (called the Mean hereafter). This will cause buying/selling pressure that will help lift/push down the underlying towards that Mean. For that to be true, derivatives trading has to be a meaningful force which is the case for some underlyings, but not so much for others. It’s important to assess this on a case by case basis.
Inflection Point Indicator: A large deviation from the Mean *can* be a indicator for a mean reversion. But there can also be structural forces at play that push net long exposure up or down over time which can cause false signals. However, when there is a visible impulse up or down, it can indicate the beginning of a momentum trade. This particularly true when net long exposure was at unimpressive levels previously.
Even though the chart pattern often suggests otherwise, derivatives traders are not necessarily just a dumb crowd of sheep the aggregate decisions of whom we can naively fade to make money. Most of them are sophisticated investors and many of them have access to superior (if not inside) information. A powerful initial impulse is therefore often a leading indicator, not a contraindicator.
It is important to realize that the absolute level of the net long exposure is secondary. It should always be assessed within historical context. The market participants, their objectives, preferences, financial background and risk appetite differ from one underlying to another. The Mean can be any level, whether it’s positive or negative.
Net Long in the Financial context
Market participants are grouped as follows:
Dealers: Banks and other financial services companies that make a market for the other participants by providing liquidity and they design and sell various financial instruments for their clients.
Asset Managers: Institutional investors like pension funds, endowments, insurance companies and mutual funds.
Leveraged Funds: Full spectrum of hedge funds and similar entities that place trades to make directional or arbitrage bets.
Other reportables: Entities that are for whatever reason not included in any of the three groups above and can include for example corporate treasuries, central banks, smaller banks, mortgage originators, credit unions or other financial services companies acting in a brokerage capacity for example.
Nonreportables: Small traders below reporting thresholds, often individuals or non-financial corporations.
I define Net Long in Financial futures and options as long minus short positions of the categories 2-5 above. The reason for that is that dealers typically carry zero directional risk. They merely act as a counterparty for the other groups. Net long of all 5 groups is zero obviously.
Some of the other groups may carry out hedges as well. But in general their trades have to be viewed in the context of their portfolios. As stated above, my hypothesis is that there is a natural Mean exposure that these market participants want to have and they will gravitate to that level over time.
Net Long in the Disaggregate context
Market participants are grouped as follows:
Producer/Merchant/Processor/User: Primarily hedge/manage risks associated with their business activity.
Swap Dealers: Enter into swap transactions with clients and hedge those in the derivatives market.
Money Managers: Hedge funds in a broader sense.
Other reportables: Market participants that clear report thresholds but don’t fit into any of the groups above.
I define Net Long in Disaggregate futures and options as long minus short positions of the categories 2-4 above. Their aggregate net positioning mirrors pretty much exactly category 1. Members of category 1 typically do not enter speculative/directional bets. Think of them like the dealers in financial futures and options.
Swap dealers do not carry directional risk either, but they hedge client trades outside of the derivatives open interest. If a swap dealer buys a future, he does so because he sold a corresponding product to a client. His long exposure represents the client’s long exposure.
Derivatives Selection
There are hundreds of financial and non-financial derivatives. I have selected the following underlyings for the purpose of this reporting:
Stocks:
S&P 500: Broad US stock market exposure, most important stock index in the world, includes futures, e-mini futures and micro e-mini futures.
NASDAQ-100: US Tech exposure, includes futures, e-mini futures and micro e-mini futures.
VIX: Leading gauge for the global price of volatility, prime instrument for leveraged short volatility bets. Once it gets overextended, a carry crash often ensues.
MSCI EAFE: Global developed market exposure, US investors’ appetite for international stocks.
MSCI Emerging Markets: Global emerging market exposure, US investors’ appetite for growth markets.
FX:
Euro FX, Japanese Yen, British Pound: Important global currencies, important sources for financial market liquidity.
Fixed Income:
2-Year T-Note: Short-term interest rates.
10-Year T-Note: Long-term interest rates.
30-Day Fed Funds: Monetary policy indicator.
Commodities:
Bitcoin: Sentiment gauge for crypto-industry, monetary policy indicator.
Gold: Monetary policy indicator, business cycle indicator.
Copper: Important industrial metal, business cycle indicator.
Corn, Soybeans, Wheat: Monetary policy and business cycle indicators
WTI Crude: Gauge for the global price of energy, business cycle indicator
Results
The dashboard below shows the 18 underlyings I selected and how market participants are currently positioned compared to historical levels.
Here is how to read the table: 79% for 520W for S&P 500 Consolidated means that net long positions in all S&P contracts (incl. E-mini and micro E-mini) is currently lower than 79% of the last 520 weeks (10 years).
And now is the output in charts. I will add commentary where I deem it relevant.
S&P 500
Over the past week, $90bn (!) worth of net short exposure has been closed in S&P futures and options, bringing the net exposure to pretty much zero.
NASDAQ-100
NASDAQ net long exposure remains moderately net long, but index options and futures trading appears to play a secondary role for the NASDAQ, both in size and statistical relevance of positioning extremes historically.
The current net long is just $4bn. If there has been a short squeeze on the NASDAQ like on the S&P, it has happened in other instruments.
VIX
Leveraged short bets against volatility remain at averages much less pronounced than in the 2010s, which is encouraging. However bear in mind that the GFC happened from positive net long levels. Black swans can show up anytime, irrespective how traders are positioned. But it helps that they are not overexposed at the moment.
MSCI EAFE
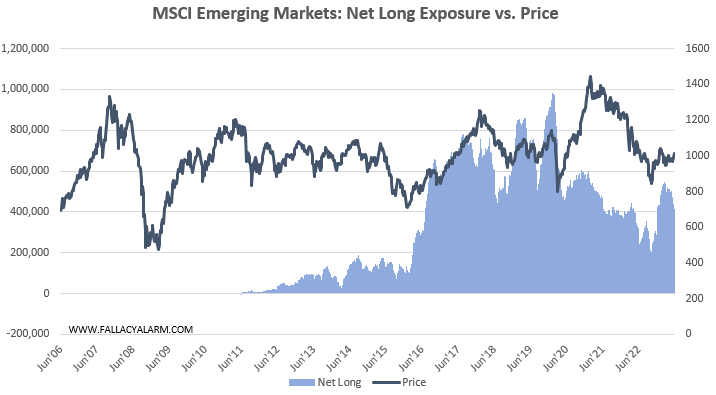
Interest in international diversification is rising in both developed…
MSCI Emerging Markets
…and emerging markets.
USD/EUR
Long Euro/Short Dollar is a consensus trade. Futures and options traders are long by a whopping $67bn. Could be a contrarian signal based on historical relationship. But not a strong signal.
JPY/USD
Opposite is true for JPY. Traders are shorting it into continued strength.
GBP/USD
Balanced positioning here after short interest has been covered.
2-Year T-Note
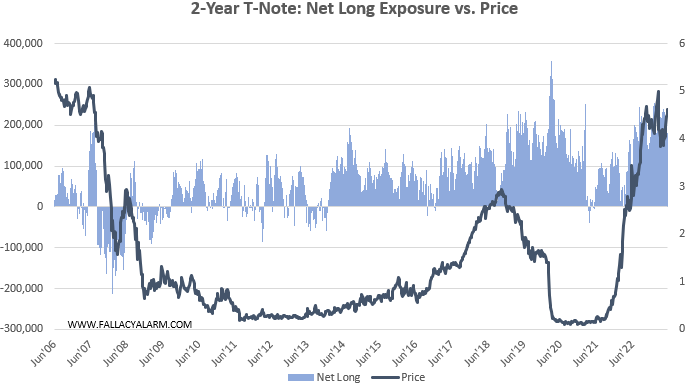
In aggregate, traders are net long (!) short-term rates which is a surprising plot twist for me since I have read the opposite many times on social media. Pain trade may very well be a continuation of high rates. Bond futures and options traders are often wrong collectively.
10-Year T-Note
Same is true for long term rates.
30-Day Fed Funds
Being long in fixed income instruments coincides with bets on falling policy rates. It is a bit discouraging that this positioning has historically often been a countersignal.
Bitcoin
Traders have BTFD on Bitcoin. But net open interest is just $200m and historical time series is very short. We can’t infer much here yet.
Gold
Surprisingly low levels that are getting lower. I view this gauge as interest in betting on QE which has not started (yet).
Copper
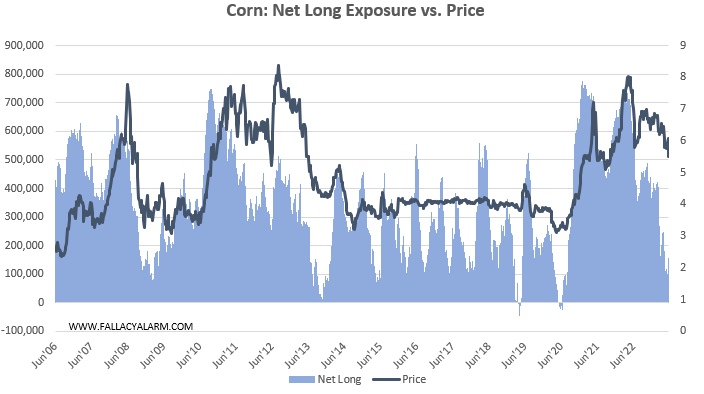
Net long exposure has come down significantly from previous peaks, but it is nowhere near capitulation levels that typically happens during recessionary times.
Corn
Same is true for the food commodities like Corn…
Soybeans
…Soybeans…
Wheat
…and Wheat.
WTI Crude
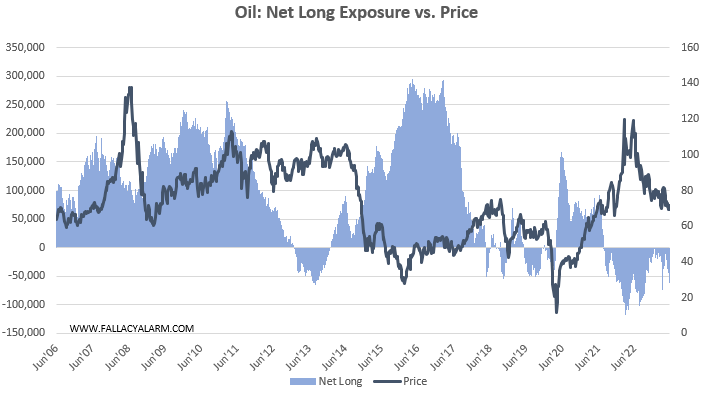
Traders are net short in crude oil futures and options. Interestingly, that has historically been a leading indicator for spot. See 2013 and 2019 for example. I view this as bearish for Oil.
Sincerely,
Your Fallacy Alarm
Attached workbook below.


