
S&P 5,000 by Christmas 2023? (Excel Workbook included)
Earnings Estimates, Valuation and Sentiment

If you are interested, I published my Jan’23 FOMC Digest earlier this week for premium subscribers:
In that article, I argued that the Fed’s hiking cycle has likely ended with the February 25bps hike, the realization of which will likely be supportive for asset prices in the near-term.
In this article, I am going to build a bull case for the S&P by assessing earnings expectations, P/E ratio and sentiment. As a heads up, this article ended up being a bit long, which is why I have included a table of contents in case you would like to jump only to some of the sections that appear most interesting to you. I have also attached my underlying workbook at the end of the article for premium subscribers in case you would like to play with the source data and/or my assumptions.
Table of Contents
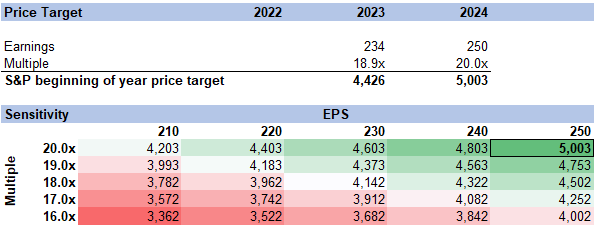
Forecast
1.1 Money Supply and Earnings
1.2 USD Valuation
Valuation
2.1 Approach
2.2 Interest Rates2.3 Equity Risk Premium
Sentiment
3.1 Short Exposure
3.2 Fund Manager Positioning
Shortly before I started working on the German equivalent of Wall Street, a friend gave me Jim Valentine’s book Best Practices for Equity Research Analysts. It’s a fantastic read if you see yourself in this profession in the future. In this book, Valentine presents his so called FaVeS framework to build a up an investment recommendation. It goes like this:
This can only be done on a consistent basis if the analyst has an edge over the market in one of the three areas that compose our FaVeS™ framework:
Forecast: Financial forecast superior to the market.
Valuation: Valuation methodology or valuation multiple superior to the market.
Sentiment: Forecast of investor sentiment superior to the market.
That’s it—nothing more. If you don’t have an out-of-consensus view in one of these three areas, you don’t have a stock call worth making.
So, in order to create alpha, you either need to know future earnings better than others or you need have a more sophisticated valuation methodology or you need to be better at anticipating sentiment changes.
I do not directly trade views on the overall market, but I am going to use Jim Valentine’s FaVeS framework today as a tool to build up a bull case for the S&P that would propel us back to all time highs before the year ends. While investor sentiment has brightened up a bit in recent days and weeks, I believe this is still an out of consensus call. I might be wrong, but I believe there are many skeptical investors out there. And those investors who are bullish often only argue about a technical short dated rally.
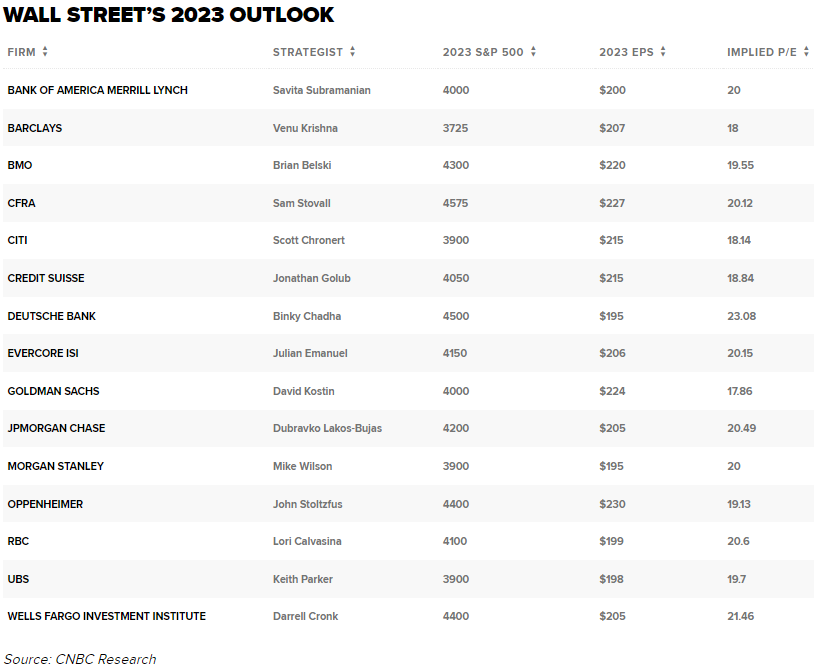
If I was a market strategist on Wall Street, this 5,000 target would comfortably put in the top spot by miles:
1 Forecast
1.2 Money Supply and Earnings
Inflation is bad for profits, right? Input prices put pressure on margins because cost increases cannot be fully passed on to customers, at least not instantly.
While this is certainly true in the short run, especially at the onset of a sharp unanticipated inflation spike, earnings generally correlate positively with inflation in the long run. Imagine for example that the central bank in your country instantly doubles money supply. It would send shock waves through the economy. But eventually all prices would likely double. Salaries would double. And profits for companies with positive margins would double, too. I have touched on this in more detail in the article below.
So, earnings should be a function of monetary debasement, at least to some extent. This makes intuitively sense. But can it be supported quantitatively? For this purpose, I am actually looking at raw money supply data as opposed to CPI, which is a highly judgmental and massaged number.
The chart below compares the growth of S&P earnings with USD M2 money supply:
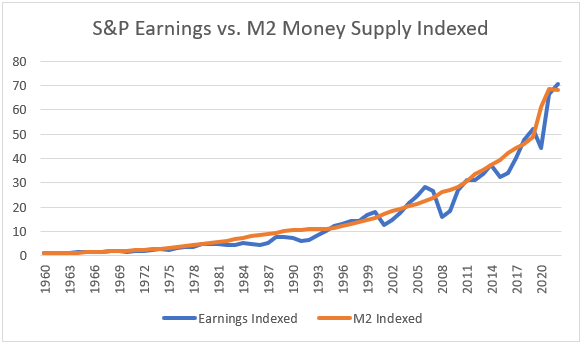
Let’s appreciate for a moment how beautiful this chart is. They aren’t just correlated, they advance at the exact same pace, namely 7% annually since 1960.
Optically, earnings are currently slightly ahead of money supply from a long term perspective, which suggests some headwind. But we are not miles ahead, earnings are at perfectly reasonable levels from a monetary perspective.
Let’s look a bit closer at most recent trends to isolate the pandemic liquidity binge effect: In January 2020 we had just shaken off recession fears that had been with us for approximately a year. The index appreciated strongly and was initially unfazed by disturbing news out of China and later Italy. It did not crash until it became obvious that the policy reactions would be fierce. What that tells me is that as of January 2020, we were completely fine. It is a reasonable base to work with. January 2020 was not a bubble. I think that is a very important statement because that is a key fault line between today’s bulls and bears.
Shortly afterwards, the great pandemic era liquidity bazooka was launched. Money supply has grown by 40% since. And earnings have grown by 35%.
This tells me that the overall increase in earnings is actually inline with monetary debasement. A cyclical bust can happen any time, but I don’t think the risk at the moment is any different from any other point in time.
Now you might argue: But if we do head into a recession, corporate earnings will contract. That may very well be true, but I believe it would be a temporary contraction and the market will likely see through it. Multiples typically expand in earnings recessions.
To the extent economic weakness suggests that the economy transitions to a slower growth trajectory compared to what was expected before, I completely agree that multiples will reflect that. I don’t see such a scenario for the US economy at this point though. Attempting to make a broader market call by assigning a multiple to cyclically distressed earnings is a road to no man’s land. We need to maintain the big picture.
So, if earnings are somewhat a function of money supply, can we use that to our advantage for forecasting purposes? At first glance, it looks pretty bad. The Fed’s tightening campaign has caused an unprecedented pause in money supply growth.

We have never had 9 months of cumulative contraction before. The closest we came to that was 1994, when money supply remained below its prior peak for 6 months.
If money supply continues to shrink, it will also be burden on corporate earnings. They won’t be able to fight this current for much longer.
But: As I have pointed out before, I believe the tightening campaign has just ended. If that is true, how quickly can money supply recover? Let’s look at 1994 and 2019 which I deem to be the most relevant comps.
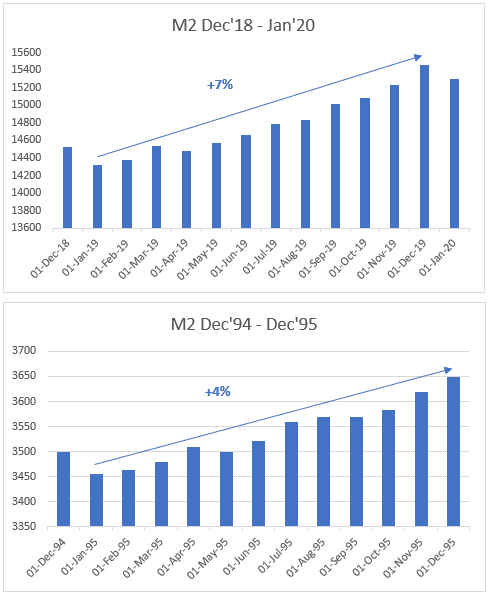
In 2019, the Fed paused in January and started cutting in July. In 1995, they paused after their February hike and started cutting in July. In both cases, money supply quickly resumed its long term growth trajectory around the dates of the pause. The most likely scenario to me is that we will see a resumption of money supply expansion soon. It might not boost earnings immediately, but markets will price in that it will happen eventually. I just want to be directionally right. I don’t care if a quarter or two will disappoint from an earnings perspective. Knowing that we are at reasonable earnings levels from a monetary perspective at the moment and considering that money supply can resume its growth path quickly once the Fed pivots gives me comfort that we are not overly vulnerable from an earnings perspective.
But there is more.
1.2 USD Valuation
The USD has appreciated a lot vs. other currencies over the past decade. As represented by the US Dollar Index DXY (a relative measure of the strength of the USD vs. 6 other influential currencies), it is up 40% since 2011. As of today, it has finally depreciated somewhat and currently trades below its 2022 average.

The reasons for this appreciation are debatable, but we can certainly point to various factors playing a role:
Strength of the US Tech industry and its rising global reach.
Better demographic set-up compared to other regions, particularly China, Japan and Europe, causing higher economic growth and attracting capital.
Tighter monetary policy/higher interest rates compared to other developed nations since the beginning of 2022 attracted capital and caused structural USD scarcity.
Fragile macro environment in 2022 caused flight to safety asset flows into USD.
At least some of these forces are still in place obviously.
It is challenging (if not impossible) to make a directional FX call based on fundamentals. There is mean reversion in currencies, but they can stay detached from their fundamentals for decades making it impossible to trade. There are certainly people seeing technical patterns they can exploit. I am not one of them.
However, what we can do is assessing the degree of the detachment to make a probabilistic assessment to gauge the size of the opportunity and whether it is asymmetric. In this article, I won’t be able to tell you that the USD will depreciate. But I will make a case that its valuation is very stretched which increases the probability that it will depreciate. And if it does so, it can be very supportive for assets quoted in USD. Most importantly: The S&P.
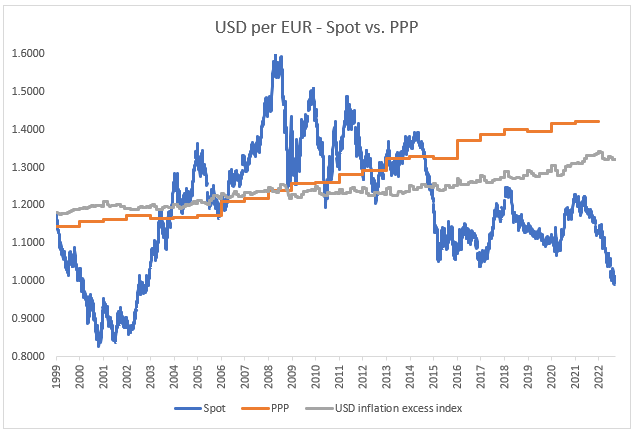
Consider USD vs. EUR for example, the most important FX pair in the world. In the chart below I have plotted the spot price vs. its PPP (Purchasing Power Parity) equivalent and a metric that I call USD inflation excess index.
PPP is a measure of the FX rate in real terms. The basic idea of PPP is that life should theoretically cost the same everywhere around the world irrespective of the currency. Imagine that you live a certain life in the US that costs you $120k annually. Then you move to Europe and live a comparable life, enjoying similar luxury. Imagine that life costs you EUR100k annually. Based on PPP, the natural exchange rate would be $1.20 per EUR1.00.
Obviously, this is unrealistic. Living expenses differ from country to country based on salary levels, geographic, social and political factors. But the directional change over time matters nevertheless.
In the USD inflation excess index, I have simply extrapolated the 1999 spot price by the USD and EUR inflation prints. The idea is that the currency with higher inflation should principally depreciate over time.
The story the chart above tells us is that the USD has never been more expensive vs. the EUR from a PPP perspective than it is today. It seems more likely than not to me that it will come down this year as the two main reasons for its strong recent performance (monetary tightening leadership and global energy crisis) are coming to an end. I think the EUR can easily appreciate by another 10% and there can still be a considerable valuation premium assigned to the USD to reflect the superior economic position of the USA.
What impact could this have for earnings? Approx. 40% of the revenues of S&P companies are generated outside of the US. If we assume that domestic and international margins are by and large comparable and the USD depreciates by 5-10% this year vs. 2022, this would translate to a 2-4% earnings tailwind.
Feel free to play with the assumptions in the attached model yourself, but for now I have derived 6.5% earnings growth in 2023 and 7.0% in 2024 based on the following considerations:
DXY to return to its 2015-2021 average to a) reverse its appreciation associated with the 2022 energy crisis and monetary tightening leadership, but to b) continue to its energy independence achieved after 2014.
4.0% money supply growth in 2023 (below its long term 7% path to reflect that 2023 will be a transition year from tightening to normality) and 7.0% in 2023.

2 Valuation
2.1 Approach
The S&P is currently trading at 19x forward earnings, which is broadly inline with the last 2 decades, perhaps actually a bit rich.

It is not so much the absolute level of the S&P P/E that makes people nervous. It is more about its level relative to bond yields. In the chart below, I have deducted the 10Y treasury yield from the inverse of the P/E ratio (E/P aka earnings yield):

The resulting chart is the so called equity risk premium (ERP). It is the spread on top of government bond yields that equity investors demand to invest in riskier assets. We’re currently not at unheard levels, but we are certainly below average when looking at the past two decades. Might this be a problem?
From this perspective, the P/E ratio is a function of the prevailing interest rate level and the ERP. Let’s look at both in more detail.
2.2 Interest Rates
Long term interest rates are still rather low in the historical context, but they are quite a bit higher than for most of the 2010s. The 10Y currently sits at 3.4%.

As you know from previous posts, I am in the camp that rates will gradually come down. It’s the story that the yield curve has been telling us for a long time and it rarely fails:
But to what level?
In 2019, the Fed had to end its hiking cycle and start cutting from below 2.5% because inflation expectations fell apart. To me, that strongly indicates that the sustainable FFR to keep inflation at bay is below 2.5%, especially considering that we’re now dealing with much higher debt levels. Assuming there won’t be any new black swans, I think we will see a new cutting cycle soon that will push us at least to 2% if not lower, which markets will magically price in ahead of time. For reference, before the plague hit, we were at 1.5% and the yield curve was essentially flat.
What does that mean for 10Y treasury yields?
A healthy bond market exhibits positive term risk premia. See for example in the chart below that the 10Y usually trades at a 100bps premium to the 2Y.

Assuming that the FFR will settle somewhere around 1.5-2.0%, I think the 10Y will settle somewhere around 2.5%.
2.3 Equity Risk Premium
There are a bunch of qualitative reasons why I believe the ERP will be lower in the future compared to the past, which mostly relates to demographics and the democratization of access to financial markets, which makes more money chasing stocks. We have seen a taste of that in 2020/21. I won’t go into more detail in this article, for further reading I recommend the articles below:
Apart from those qualitative reasons, I believe the ERP is currently distorted because markets are pricing in falling yields. This happens mostly at the short end, but it has ramifications across the entire yield curve. Going long bonds and underweight stocks is a consensus trade. Consensus trades work until they fail.
If you invest in stocks today, you get the earnings yield and growth into perpetuity. If you buy a 10Y bond, you will have reinvestment risk in 10Y. I believe the expected perpetual return from an investment in 10Y bonds is significantly lower than 3.4%.
When the yield curve inverts and the ERP tanks, this does not necessarily have anything to do with irrational exuberance. Market is simply pricing in falling yields. I don’t have strong feelings about where the P/E ratio for the S&P should be, but I am comfortable that we are not overly detached from reality at the moment.
Overall, I believe an ERP of 2.5% is healthy. If the 10Y is at 2.5%, this would bring the earnings yield to 5.0% which would bring the multiple to 20x, which is roughly inline with the current valuation.

3. Sentiment
3.1 Short Exposure
In the face of the recent pop in financial markets, particularly for junk stocks, I have seen quite a few people warning about a return of greed. What did people expect? Linear tailspin to zero?
In my opinion, it’s a misread on the current situation.


Actual sentiment is still very cautious. Disappointing returns in the past two years have flushed a lot of money to the sidelines or even beyond to the dark…eh short side. Look at all that short exposure below:

The last time we had meaningful short spikes like this, the markets ran 25% (after Jan’19) and 60% (after Jun’20) thereafter. 5,000 is just 20% away. Isn’t it more likely than not that the market will run there this year to harvest the implicit and explicit stop losses of all those shorts? I think they are highly vulnerable and cannot afford their exposure.
3.2 Fund Manager Positioning
Let’s take a closer look at positioning during the last short exposure spike: June 2020.
Look at the BofA Global Fund Manager Survey at that time:

Equities were heavily underweighted, almost an entire standard deviation vs. historical weights. Energy was even 1.5x standard deviations below historical weight. And you know how it performed thereafter.
The picture was very similar in early 2019, when equities were also underweight by 1 standard deviation.

Today, equities are underweighted by more than 2 standard deviations!
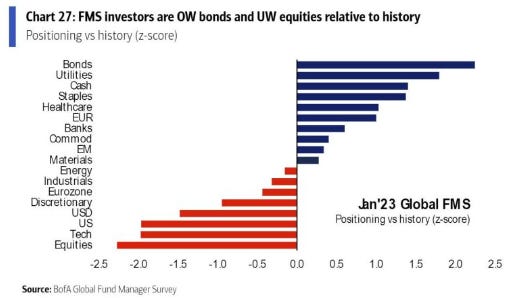
Fund managers are long bonds and short stocks. And to the extent, they are long stocks, they are in defensive sectors (stables, utilities, healthcare).
I stand by my prediction from earlier this year:
S&P 5,000 by Christmas. Can’t wait to revisit this article at the end of the year to either celebrate or tear myself apart. :)
Sincerely,
Your Fallacy Alarm
Check out the underlying Excel workbook below.
