TSLA Earnings Preview: Fruits are hanging low. (incl. Excel Model)
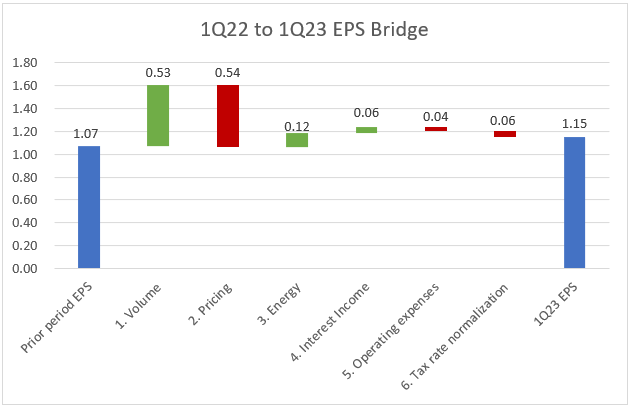
Bridging 1Q22 and 4Q22 to 1Q23 by adjusting for key parameters, incl. volume, pricing and energy.
Did you expect anything else but optimism from me going into earnings? :D In this article, I will present two potential scenarios for earnings next week, both of which would be a beat vs. consensus. For premium subscribers, I have attached the Excel model with the underlying calculations which also comes with full 2019-2022 quarterly income statements incl. some of the key metrics I am looking at. For free subscribers, I have added in screenshots of the most important sections throughout so you can follow my reasoning.
The Importance of 1Q23
I usually do not worry too much about quarterly earnings because ramping TSLA 0.00%↑ ’s business is inevitably volatile with flat periods followed by step changes, when new factories hit scale for example. 1Q23 will be exceptionally important however for two reasons. Firstly, it is the first quarter with impacts from the price cuts. It is our first opportunity to understand how much of those price cuts come from a position of weakness (stimulating demand at the expense of profits) and how much is the result of strength (passing on efficiency gains to customers to increase their TAM). Secondly, it is also the first quarter where we can see some of the impacts from Tesla’s new megapack factory.
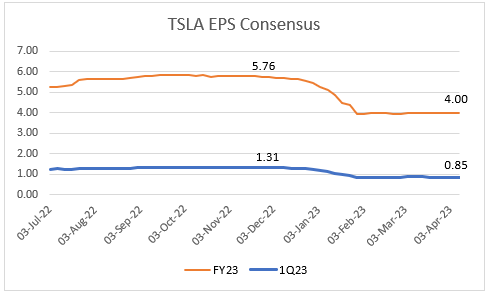
Markets are very skeptical going into these earnings. Compared to November, FY23 EPS consensus is down by 30% to $4.00. And for 1Q23, it’s down by 35% to $0.85.
And the stock has been consolidating for the last two months. It has underperformed its peers significantly in recent weeks and even in upward moves it has mostly disappointed when taken its beta into consideration. There is pretty much zero optimism going into earnings. One influential narrative is well summarized by Toni Sacconaghi:
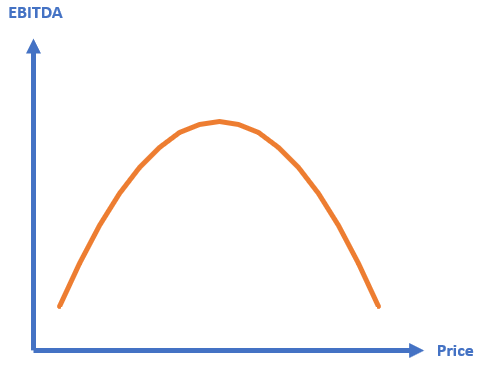
I don’t think Tesla is trading profits for sales. I believe every car they sell is profitable for them. They might be trading margin for sales as they are currently in the process of finding the pricing mix that maximizes $ earnings, both short-term and long-term.
My Approach
Forecasting Tesla’s quarterly earnings bottom-up is extremely difficult as they have more moving parts than an internal combustion engine. We don’t have much insight into what Tesla is achieving right now before they report it. But we do know exactly what they have achieved in the past. And we also know quite a few things that are different today vs. that past.
This is why I am building up an estimate today for Tesla’s 1Q23 non-GAAP EPS by bridging their 1Q22 (YoY) and 4Q22 (QoQ) earnings to today. 4Q22 is of course relevant because it is the most recent data point. But I consider 1Q22 a relevant benchmark as well because it was the last quarter before many temporary events distorted the true underlying performance, incl. the Berlin and Austin ramps, the Shanghai lockdown and the global inflation shock. You can view the YoY bridge as an upside case that assumes that Tesla has overcome some of its recent challenges. And the QoQ bridge could be viewed as a downside case assuming that they are still struggling.
My bridge is based on the following parameters:
Volume: Adjusting for more deliveries
Pricing: Adjusting for price cuts
Energy: Adjusting for more MWh deployed
Interest Income: Adjusting for higher interest rates
Operating expenses: Reflecting inflation and growth of the business
Tax rate normalization: Incorporating a higher tax rate
1. Volume
You will see tables like this throughout the article. The green column is the YoY bridge (1Q22-1Q23), the yellow column is the QoQ bridge (4Q22-1Q23).
Tesla’s fully diluted 1Q22 non-GAAP EPS was $1.07. In 4Q22, it was $1.19. I don’t like the add-back of SBC for non-GAAP purposes. But it is the number that will float through all media channels next week. So, we might as well just forecast the figure everyone will be talking about.
To incorporate the EPS impact from the delivery increase, I have as a first step derived the incremental revenue by multiplying the additional units with the prior period ASP.
As a second step, I have then deducted their marginal COGS for each vehicle. Plotting the quarterly delivery changes against the quarterly increases of COGS reveals a close relationship between the two metrics. Statistically speaking, over 90% of the changes in Tesla’s COGS are explained by changes in vehicle deliveries. While that might not be a huge revelation for you, I’d still like to point you the the slope of the chart below. It is 32.097 ($k). That is the incremental cost for every additional delivered during a quarter. It’s much lower than their total COGS/car which was $39k in 4Q22 and $37k in 1Q22. That’s operating leverage.
I have selected $33k marginal COGS per additional vehicle, slightly higher than the regression result above to be somewhat conservative and reflect inflationary pressures potentially lingering on. After adjusting for taxes, this volume impact on EPS is +$0.53 YoY and +$0.08 QoQ.
2. Pricing
I would love to stop there. But of course we know that massive price cuts will have an offsetting impact. ASP was $52k in 1Q22 and $51k in 4Q22.
It is extremely challenging to get clarity on this parameter for 1Q23 because there have been so many price cuts for so many trims in so many markets at so many different times. And all of these hit the income statement with unknown lags. We do have one anchor however, which is Zach Kirkhorn’s ‘$47k is the floor’ comment during the 4Q22 earnings call:
“We believe that we'll be above both of the metrics that are stated in the question, so 20% automotive gross margin, excluding leases and credits, and then $47,000 ASP across all models.”
Zach Kirkhorn, 4Q22 earnings call
We also have a little bit of an FX tailwind QoQ at least since the Dollar has declined. Assuming an average 8% price cut across the entire line-up, I believe $47-48k is a reasonable assumption. After incorporating the volume impact, this pricing impact would hit EPS by -$0.54 YoY and -$0.33 QoQ.
3. Energy
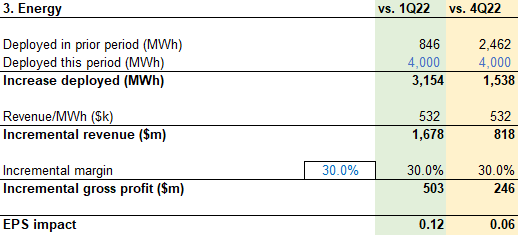
Lathrop started producing in 4Q22. It will hit the income statement with a lag because revenue recognition is dependent on the installation progress of each project. But we should see some impact this quarter. Lathrop will ultimately add 40GWh to Tesla Energy, which would be 10GWh quarterly. I have selected 4 GWh as my estimate for 1Q23, which would mean the factory has been 40% ramped (in terms of revenue recognition that is, not production).
This would boost EPS by +$0.12 YoY and +$0.06 QoQ.1
4. Interest Income
Interest rates have spiked hard over the past year. Tesla’s implied cash interest rate has risen from 0.8% in 1Q22 to 2.8% in 4Q22. Interest rates seem to hit their income statement with a lag however, presumably they have a bit of duration in their investments. It’s also prudent to assume that they have a good amount of cash in non-interest bearing checking accounts for operating purposes. Plus, we don’t really know the average daily balance throughout the quarter. Current short term rates are ~4.5%. Incorporating this would improve EPS by +$0.06 YoY and +$0.02 QoQ.¹
5. Operating Expenses
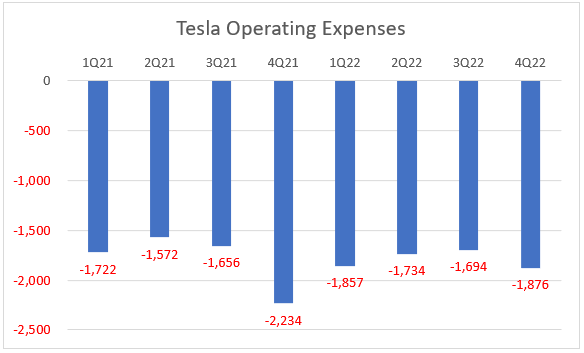
Considering that Tesla has doubled vehicle output over the past two years, their operating expenses have stayed remarkably flat. There is some SBC distortion here, but irrespective of that, there is barely any trend noticeable in the chart below:
I do believe it is prudent though to reflect some operating expense increases for 1Q23 because the company is growing fast and inflation has been real. I have assumed they spent $2bn, which would hit EPS with -$0.04 YoY and -$0.03 QoQ.
6. Tax Rate Normalization
Tesla has had ridiculously low tax rates in recent history. 10% in 1Q22 and 7% in 4Q22. To be honest, I have no clue what to expect on this metric, but again better be safe than sorry. I have reflected a tax rate increase to 15% in my estimate, which would hit EPS with -$0.06 YoY and -$0.09 QoQ.
Bridged EPS
Putting it all together, bridging 1Q22 EPS of $1.07 to 1Q23 would suggest $1.15 EPS.
And it would be $0.90 when bridged from 4Q22.
Reasonableness Check
This is significantly more than the $0.85 consensus. Importantly, I believe my estimate is not overly ambitious. In fact, I believe I have leaned towards the conservative side where possible. I have also not included some potentially positive drivers such as:
Increased FSD take rate due to the wide beta release since November
Positive impacts from the insurance business, which is growing faster than the vehicles business according to Zach Kirkhorn
Further improvement in the Services business (charging most importantly), which has demonstrated rapidly growing gross profit contributions since it reached break-even in 2Q22
You will find the detailed version of my forecasted 1Q23 income statement in the attached model. But I want to comment on the most important metrics here as well.
Auto Gross Margin
My YoY bridge predicts Auto gross margin ex credits of 24.2%:
It feels a bit rich to be honest. Pretty much in line with 4Q22 in spite of additional price cuts? I do however lean more towards the YoY bridge as opposed to the QoQ bridge. Tesla has amazing operating leverage and without price cuts they would also likely have expanded their margins. Berlin and Austin should also be less drag by now. As a reminder, 1Q22 was an exceptionally strong quarter with very mature factories because Berlin and Austin had not started production yet.
COGS per vehicle
You can see that quite well in the COGS per vehicle chart below. Once Berlin and Austin came online in 2Q22, COGS per vehicle jumped from $37k to $41k, easily worth $1bn gross profit lost.
That is what Elon meant when he talked about money burning furnaces. To be fair, it wasn’t just those two factories though. 2Q22 also got hurt from Shanghai lockdowns.
Arguably, $36k COGS per car in the YoY bridge feels a bit ambitious. But here is some supportive context I have been pondering about:
We had a slightly lower S/X delivery share (2.5% vs. 4.2% in 4Q22 and 4.7% in 1Q22), which could impact COGS per vehicle by ~$1k in my opinion.
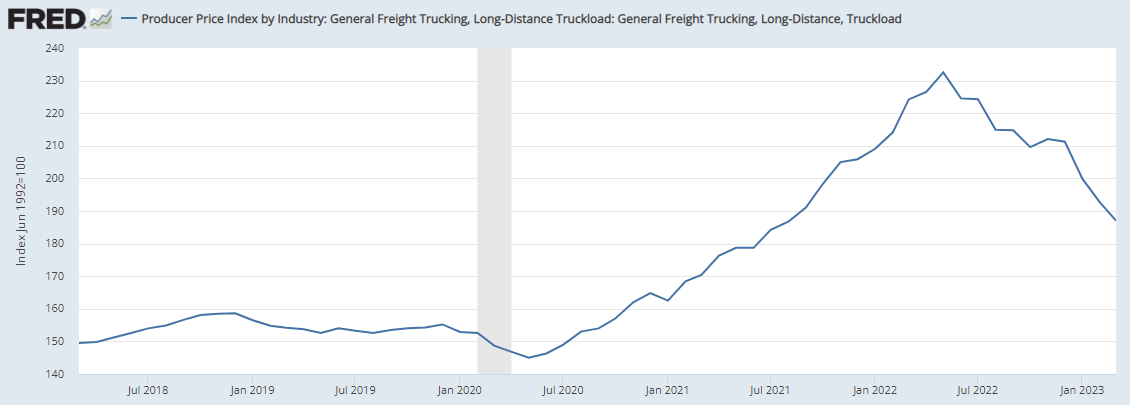
Freight rates have come down from their peaks. In some instances, they are even lower now than 1Q22.
Tesla has consciously started unwinding their EoQ delivery wave, which should reduce shipping costs (at the expense of prettier EoQ financial statements).
Overall, I believe that my two bridges build a decent range with an upside case of $1.15 and a downside case of $0.93, both of which would be a beat vs. the $0.85 consensus. I don’t know what will happen next week. The only thing I know for sure is that I will be wrong. But I would have to be VERY wrong for Tesla to miss consensus. A clean beat would be nice for a change to lift us from the current moodiness.
What do you think?
Sincerely,
Your Fallacy Alarm
Model below


