
When Dollar Short-Squeeze?
Endless liquidity creation incentivizes investors to overown assets and underown cash. Market forces will have to heal these portfolio imbalances eventually.

In April 2023, I provocatively asked When Short-Squeeze?

I highlighted the incredible level of caution and bearishness of investors evident in numerous positioning and sentiment indicators and I suggested that this was due to excessive recession fears that misunderstood the role of interest rates in a fiscal dominance regime. I argued that this setup had to unravel through a short-squeeze. Mr. Market had to force investors into a more reasonable asset allocation.
Today, I am again asking When Short-Squeeze? But this time I mean the complete opposite. I am not asking about a short-squeeze in underowned stocks, but a short-squeeze in an underowned US Dollar.
What follows below is not just the preparation for a macro call. It’s also a primer on how the financial system works. If you can spare the time, please do yourself a favor and read it fully and carefully. No skimming through. No asking ChatGPT for a summary. If you fully understand this article, you will understand macro better than 99% of the people out there.
TLDR Summary
Liquidity creation is the creation of Dollars and its proxies. It has been running hot for years, fueling the bull market. Consensus expects it to continue indefinitely.
As a result of that consensus, investors are structurally short Dollars via leverage, low cash and high valuations.
The unwind may come if liquidity creation disappoints, for example via smaller fiscal deficits, weaker than expected credit demand or rising interest rate volatility.
Until then, the infinity bid seems bound to continue. Unless valuation spreads may soon reward investors who stack the earnings of unfashionable assets rather than buy & hold momentum. There is a mechanism that can make valuation matter again.
More similar content from Fallacy Alarm


What does ‘going up in value’ actually mean?
We usually don’t think much about it when we say “asset X went up in value”. But it’s worth reflecting what ‘going up in value’ actually means. There is no objective and absolute definition of value. Value is always relative. The value of something is always assessed in relation to the value of ‘something else’.
That ‘something else’ is usually the US Dollar. It’s the world’s dominant currency and it’s the most important yardstick for all other assets. When people talk about the ‘everything bubble’, they could also be talking about the US Dollar crash. In fact, many Bitcoiners take exactly that perspective.
If the value of something falls, it’s often because the supply of it is excessive. Therefore, let’s look at the supply of US Dollars.
Dollar supply
Fed Dollars
The Fed is the only true supplier of Dollars. Every bank note, coin and reserve balance is a claim against the Fed. These are the Fed’s liabilities which it uses to buy assets or hand out loans. These assets and loan receivables serve as the collaterals for the bank notes, coins and reserve balances.

In the past, physical cash was secured by gold. Today, it is secured by financial assets held by the Fed, most importantly Treasury securities which are in turn secured by the government’s revenues, i.e. its tax receipts. Tax receipts depend on the power of the US economy which is the ultimate guarantor for the value of the Fed’s liabilities.
The supply of Dollars from the Fed has actually been very weak over the last years. In fact, it has been negative for more than three years. In theory, this should raise its value against stocks and other assets.
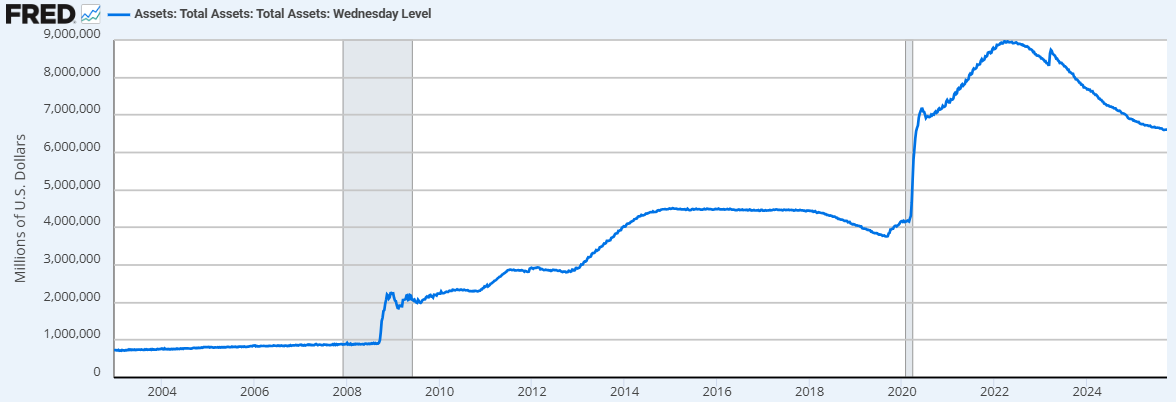
However, there are assets that are very similar to actual Dollars. When they are created, they can effectively increase the Dollar supply. The two most important ones are commercial bank deposits and Treasury securities.
Commercial bank deposits
Fractional reserve banking allows the amount of commercial bank deposits to greatly exceed the amount of Fed dollars. When a commercial bank receives a freshly printed Dollar from the Fed, they can lend it to a customer. The customer uses it to pay a supplier. The supplier deposits it with another bank. That bank lends the same Dollar to another person. It’s again used to pay a bill, ends up again as a deposit and the whole cycle repeats. Theoretically, this can raise commercial bank deposits to infinity. In practice, banks have capital requirements, of course. They can’t use all deposits for lending which limits credit creation to a factor of about 5-10x.
These bank deposits aren’t claims against the Fed, but they are de facto Dollars. Most people with a desire or need to hold Dollars are close to indifferent between holding claims against the Fed (physical cash, reserve balance or RRP) or against a commercial bank (commercial bank deposit). Trust in the US banking system is high. The claims are near identical in risk and duration.
Treasury securities
Treasury securities are also Dollar proxies, however less so than bank deposits. Firstly, they are not practical means for transactions. And secondly, most of them have duration. Every central bank Dollar and most commercial bank deposits have zero duration. Their value doesn’t fluctuate with interest rates, at least not in nominal terms.
In contrast, if the interest rate for a 10-year Treasury bond rises 1%, it drops about 7% in value. That makes it a risky asset which may not be suitable for someone who needs to hold pure Dollars for transactional purposes or near-term financial obligations. Issuing Treasury securities doesn’t necessarily increase Dollar supply. That’s why the official money supply doesn’t include those with a duration of more than a year.
However, the lower the interest rate volatility, the ‘proxier’ the Treasury securities become, even at longer tenors. If rates were zero and implied rate volatility was zero (i.e. certainty that rates will remain zero along the entire yield curve), the entire Treasury market would become money supply. It would be a huge Dollar supply shock sending the value of the Dollar down and everything else up.
Putting all sources of Dollars and Dollar proxies together
Fed Dollars, private credit creation and the money-like portion of Treasury securities determine the supply of Dollars. Measuring that is surprisingly difficult. I have spent countless hours defining and redefining it, for example in the article below.

Today, I tend to keep the definition very simple and narrow: Treasury deficit spending plus growth in loans and leases. Here is why:
1) Why ignore Fed money entirely: When the Fed creates liabilities, they provide others with new Dollars. However, they typically use that ‘borrowing’ to finance purchases of Dollar proxies, most importantly Treasury securities. That tends to cancel the effect or at least greatly negates it.
For example, has the supply of Dollars really changed when the Fed buys a Treasury security from a bank and credits the bank’s reserve balance with the purchase price? The only thing that has happened is that the bank now has a claim against the Fed instead of a claim against the Treasury. Yes, duration may have been introduced as an additional risk. But the counterparty remains the same: the US government. If the Fed bought NVIDIA stock instead it’s a different picture. Then they would certainly raise Dollar supply. But I have come more and more to the conclusion that Treasury securities are more Dollar-like than they are not. Especially in an environment where bill issuance gains in importance.

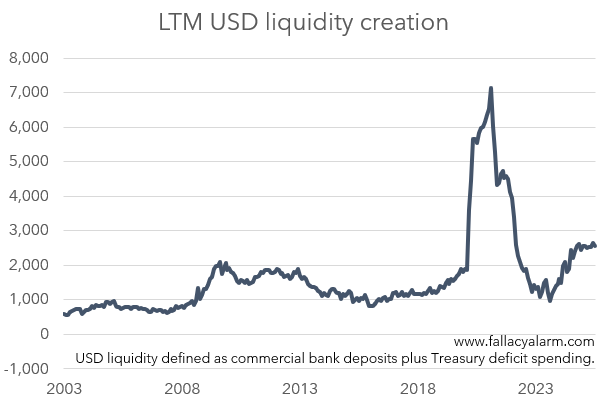
2) Why ignore securitized private sector borrowing? Unsecuritized borrowing is included in commercial bank deposits. But corporate bonds are not. If Apple issues a corporate bond, that may increase Dollar supply. Someone who wants or needs to own Dollars may to a certain extent be indifferent between actual cash and a debt instrument of a well-capitalized blue chip company, especially if duration is short. However, there is still a chasm between a private and a public borrower which I tend to not want to cross. Luckily, the story told by the chart below won’t change much if I included corporate bonds. So whatever we feel about them, we can safely ignore them. At least for today.
Now, the chart below plots the last twelve month change in USD liquidity (aka creation of Dollars and its proxies).
Now, what do we make of this chart. To fully appreciate it, we need to understand:
Assets as liquidity plays
In the past, investors have looked at most assets from a micro perspective. They asked about the asset’s income potential and its risk profile to gauge how long it will likely take for the asset to return the original investment. That’s the idea of value investing.
Only a very small minority of investors actually perceived assets as liquidity plays. They asked how many more units of this asset will be created going forward and how does that compare to the pace at which Dollars are created. If an asset was diluted at a slower pace than Dollars, it would make sense for people to convert their Dollars into that asset. Gold is the most famous of such assets. That’s why it had such a huge bull run in the 2000s when the liquidity chart above accelerated. It formed its bubble top in 2012.
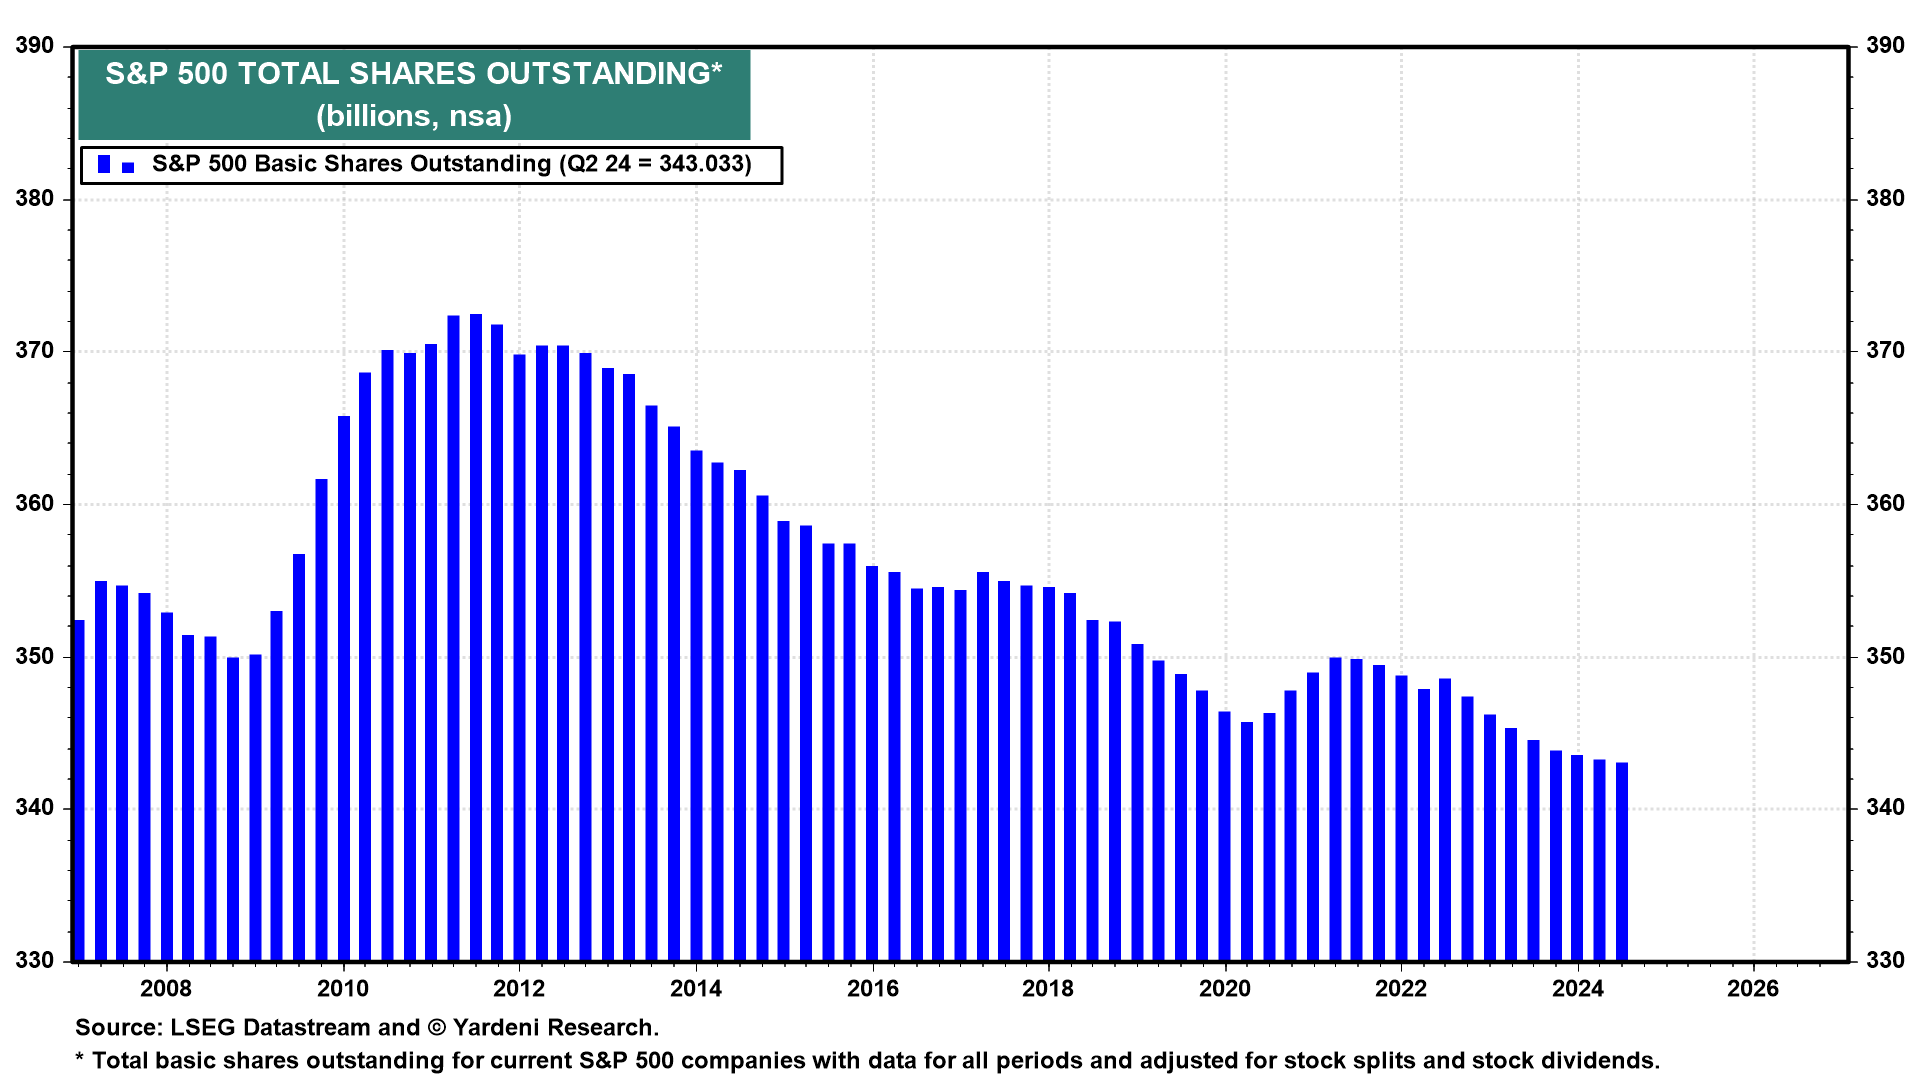
What we are seeing today is the ‘goldization’ of many assets, most importantly US stocks and Bitcoin. Buying the S&P 500 is not a bet on payback periods anymore. It’s a bet that the S&P 500 shares outstanding will grow slower than the supply of Dollars and its proxies. In fact, its shares outstanding are falling.
Putting that into the context of the 2020s so far
Treasury deficit spending has obviously been by far the most important liquidity driver over the last five years. Its acceleration in 2020 caused the 2020/21 bull market. Its slowdown in 2022 caused the 2022 bear market. And the reacceleration since late 2022 has caused the bull market that started then.
Volatility in Treasury deficit spending was not the only driver for the volatility in asset prices. Rate volatility amplified this effect and it’s unfortunately not an easy task to capture that in the liquidity chart above which is why I haven’t tried doing so.
But we can qualitatively appreciate it. The Bank of America’s MOVE Index measures expected interest rate volatility from options on Treasury securities.
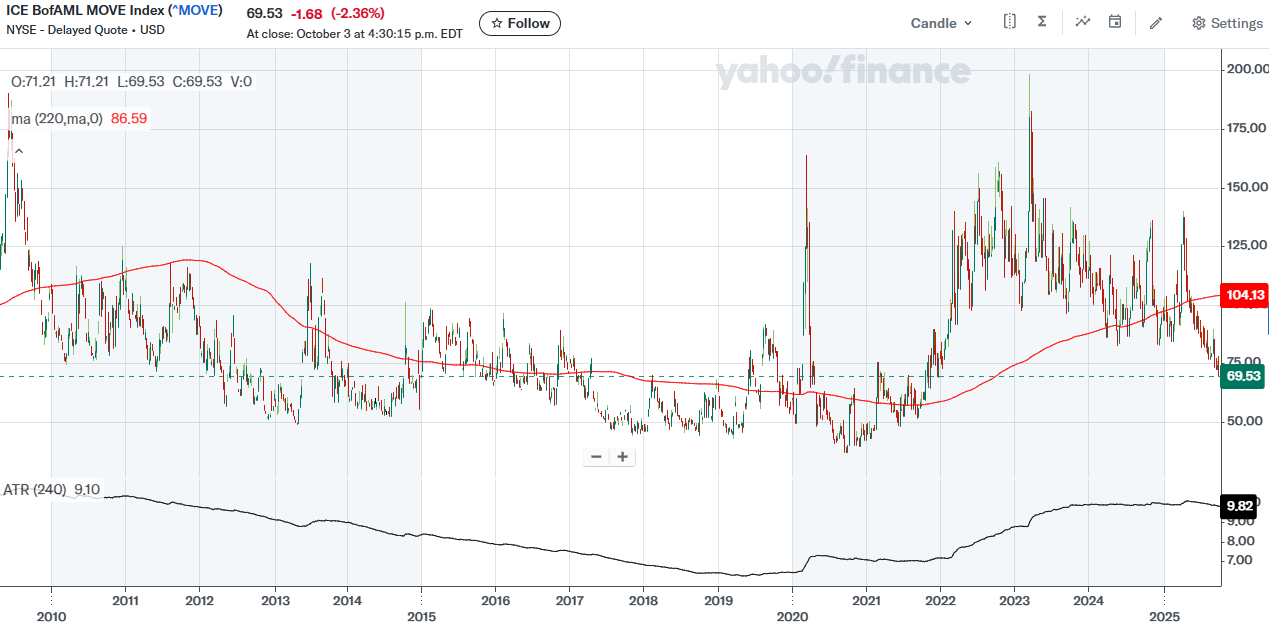
In the late 2010s, it hovered at around 60 which means investors expected the yield curve to have a volatility of 60 basis points per year. This was far below the historical average of about 80. As a result, the ‘moneyness’ of Treasury securities was very high. Many investors were near indifferent between holding cash or a Treasury security. This raised effective Dollar supply and devalued it against other assets, such as US stocks. Falling rate volatility drives asset prices up.
In the 2022 bear market, the MOVE Index surged higher. This lowered effective Dollar supply and amplified the decline of stocks and other assets. Treasury securities became risky assets. Unsuitable as Dollar proxies.

Since 2023, expected rate volatility has come down alongside a reacceleration of deficit spending. This has increased effective Dollar supply and hence fueled the bull market.
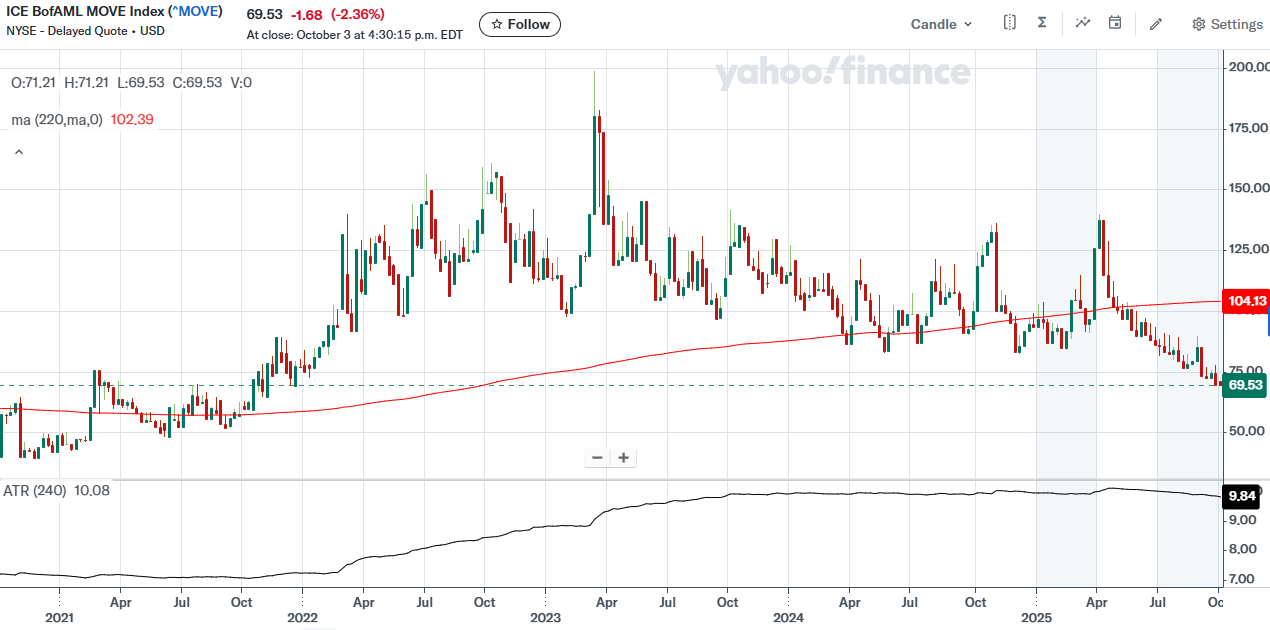
The latest reading of the MOVE Index is 69, which is below the long-term average of 80. Further decreases in the MOVE Index seem only likely with QE and yield curve control.
The annual supply of Dollars and its proxies currently stands at $2.5tn annually per the liquidity chart above. With exception of a temporary distortion during the pandemic era, this is significantly above historical levels.
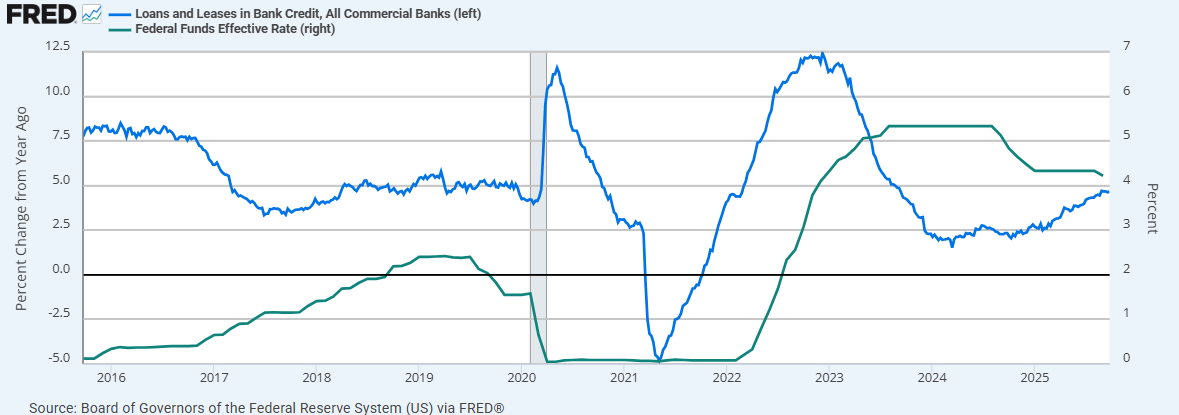
Investors clearly expect a continuation of that trend. It is perhaps the broadest consensus out there. There is no indication that fiscal liquidity creation will slow down and private credit creation seems to be reacting positively to rate cuts already. Growth in loans and leases started accelerating in late 2024, shortly after the first rate cuts.
There is currently no reason for anyone to fear a slow down in liquidity creation. Look at the responses fund managers gave in the last fund manager survey regarding the biggest tail risks:
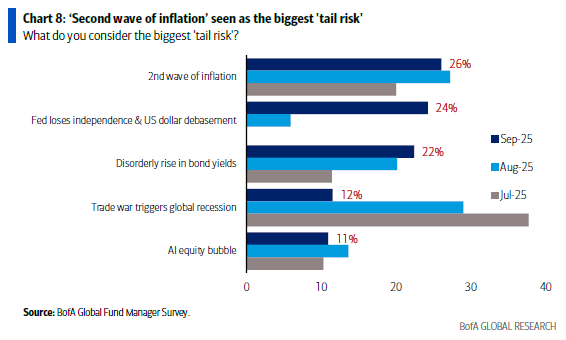
The top two fears, inflation & Dollar debasement, are actually manifestations of increased liquidity creation! These are positive scenarios for nominal asset prices! It’s an absurd fear to have.
Why does nobody fear that the US administration may be serious about cutting deficit spending? Why does nobody fear that rate cuts might be ineffective in triggering private sector credit demand? Why do only 10% fear that the trade war triggers a global recession? It’s the most serious international trade surgery in a long time.
I am not even predicting these risks to materialize. I would simply like them to have a price. A risk can’t have a price if nobody fears it.
I fear that the belief into an everlasting strong liquidity creation is forcing investors into asset overexposure. Or in other words: I fear an excessive Dollar short position.
What evidence is there for an excessive Dollar short position?
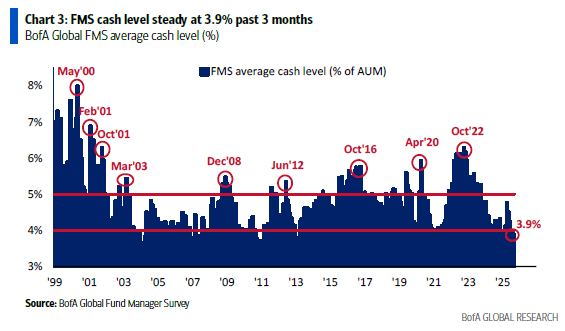
Record low cash allocations of institutional investors
Institutions continue to have record low cash allocations. You have seen this chart many times before.
Accelerating margin debt
The Financial Industry Regulatory Authority, in short FINRA, requires US broker-dealers to report margin balances in customer accounts. Per September 2025, the latest data point, the aggregate margin balance stands at $1.1tn.
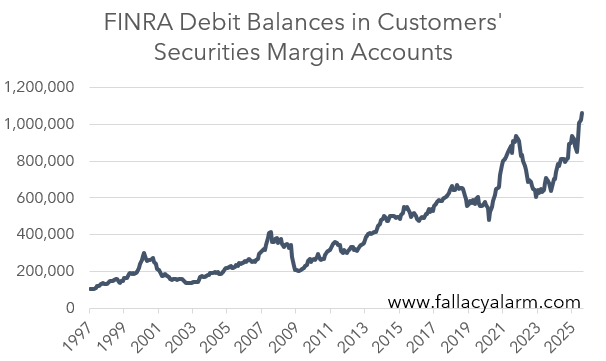
You might want to argue that an increase in this balance over time is normal and consistent with liquidity growth. Compared to total market cap it may not be excessive. However, the momentum is more important here than the absolute level. Over the last twelve months, this balance has grown by $260bn or 33%. In the past, periods of such acceleration have always preceded significant corrections. It's not a healthy pace, esp. considering that September 2024 was not a market bottom where many longs would have been margin called.
Hidden leverage in ETFs
It’s problematic to compare margin balances over long periods of time because of shifting leverage preferences. Lately, investors prefer to express their leverage not in explicit margin balances, but in levered ETFs instead. These rebalance daily and are more suitable to bet on momentum then outright margin balances. A levered ETF can’t get margin called.

These ETFs use different means of borrowing, most importantly derivatives structures. The FINRA reporting doesn’t capture their borrowing.
Leveraged ETFs command about $160bn in assets under management. The largest one of them is TQQQ 0.00%↑ with almost $30bn in assets. This ETF alone controls tech stocks worth $90bn. Every day NASDAQ rises, it borrows and buys more. Every day NASDAQ falls, it sells and reduces leverage. The result is a monstrous momentum player that amplifies market moves in both directions. I can imagine there is a lot of investor capital riding the wave of that ETF.

Valuation Saturation
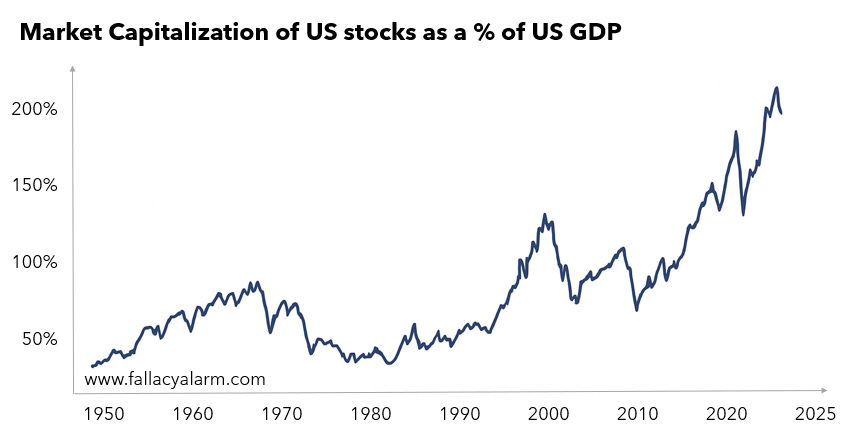
In the article below, I assessed the relevance of the Buffett Indicator, which compares the market cap of US stocks against the size of the US economy.

Globalization dilutes the relationship between both metrics. However, the price of US stocks remains a bet on the nominal growth of the US economy. It’s still the most important market for US companies.
The present value of an income generating asset is its current income divided by the difference of the required rate of return and the income growth rate. The higher the Buffett Indicator, the more nominal growth is baked in stock prices.
Excessive performance vs. bonds
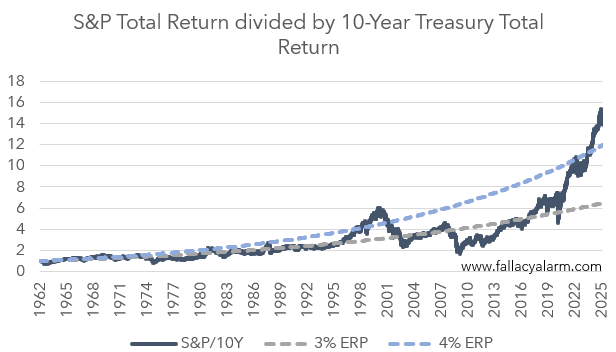
In the article below, I highlighted the astonishing outperformance of stocks vs. bonds over the last five years.

Stocks should outperform bonds over time because of their increased risk profile. Their annual outperformance is typically called equity risk premium. The current valuation of the US stock market is consistent with an equity risk premium far above historical benchmarks.
Collectively, these metrics show investors are explicitly and implicitly leveraged to bet on liquidity continuation.
How could this unravel?
Liquidity growth forever?
It’s tempting to believe that all of this can only end with a shock to liquidity creation. Lower deficit spending from tariffs for example. Or anemic credit demand in the private sector, even with lower rates. As long as these shocks are not happening, the party will go on. Dollars and Dollar proxies continue to be created at record pace and investors yolo them into stocks. The last S&P 500 ETF buyer will pay a million Dollars for the last available S&P 500 share.
However, I have been thinking whether there could be natural mechanisms to stop this. Markets should be able to price in any scenario and find a stable equilibrium price. I believe they will eventually be able to do so.
Buy & hold vs. stacking
To illustrate that, imagine two assets representing extremes, asset A and asset B:
Asset A has no or at least no meaningful earnings. It could be a thematic or a meme stock, Bitcoin, or even the ultimate nature of today’s US stock market. The return of asset A entirely depends on new buyers coming in to pay higher prices.
Asset B has very high earnings relative to its price. Think of traditional value stocks, small private businesses or real estate in out of favor industries.
The higher the valuation of asset A, the more will owners be tempted to turn paper wealth into consumption. At $10,000 in your investment account, you sit tight. At $100,000, you might consider buying a new car. At $10,000,000 you might start thinking about an airplane. The higher the valuation, the fewer shares you need or want to achieve your financial goals.
Management of asset A will behave similarly. High valuations make capital cheap. All else equal, you need to issue less shares to finance the same growth project. That cheap capital encourages them to spend more aggressively and tolerate losses. We’re seeing this dynamic play out right now through the AI capex boom.

Hence, the more people bid into asset A, the more supply of it will be unlocked. More supply leads to lower prospective returns. Just like more Dollar supply lowers its value as discussed earlier.
Conversely, the less investors bid into asset B, the scarcer its supply becomes. Its shareholders are poorer. They sell less and they consume less. B’s high cost of capital constrains new issuance. We’re seeing this dynamic play out right now in the energy and commodities space where companies are aggressively buying back shares. Increased scarcity lifts its prospective returns.


At some point, B’s prospective returns will exceed A’s. Even if A is more attractive to own, investors can outperform by buying B instead and stack its earnings into A. Over time, buying B is a faster way to acquire A than buying A outright. The FOMO push into A burns out.
I don’t pretend to know where we are in that process. But it’s a reminder that valuation still matters. It always has. And it always will.
Sincerely,
Rene