Why is Tesla stock so manic?
A never ending sequence of bull flags interrupted by upward spikes is part of its nature. Here is why. And what might come next.
TSLA 0.00%↑ hit $247 tonight in AH trading, 10% higher than yesterday at close. On the surface, this was driven by GM 0.00%↑ ‘s adoption of Tesla’s supercharger network contributing to the trend to make them the Standard Oil of the Electrical Age. $60bn value creation in a day. Mary led. Tesla shareholders into nirvana.
YTD the stock has now doubled. Not many people deemed that possible, but if you are a regular reader, you know that I have anticipated exactly that.
And I have gone through hell with my personal account for walking my talking. I have written about that earlier this year until my hands were bleeding, most importantly here:
I’m not saying this to brag. After all, it can reverse quickly. But it doesn’t harm to celebrate wins occasionally and you know that I don’t flip flop. You can always expect a maximum of integrity, focus and consistency from me. At least I’m striving for it with every word I type.
The stock fell 65% in 2022 after having climbed 50% in 2021 and 740% in 2020. If it was a person, a doc might reasonably diagnose a manic depression. We all have learned to live with that as much as we can and sometimes I even believe it’s not a bug, but a feature that actually enables its superior long term performance.
But the one question is still nagging: Why does Tesla notoriously move in a never ending sequence of bull flags interrupted by upward spikes?
It’s not normal for a stock to act like that, particularly for a multi hundred billion gorilla. The S&P and most of its largest constituents typically move in a rising wedge pattern interrupted by downward spikes. Volatility is suppressed on the way up and amplified on the way down. Pretty much the opposite of Tesla.
Why is that? Why can’t Tesla move in a nice MSFT 0.00%↑ style parabola?
In my opinion, there is a philosophical and mechanical explanation. In this article, I will summarize both for free subscribers. For premium subscribers, I will also dive into the details of mechanical explanation in the second half.
Philosophical
In March 2022, I published my mental model for holding Tesla. Without it, I would have sold long time ago.
Identifying big winners doesn’t take much to be honest, it’s not rocket science. I believe the main challenge in investing is not finding them, but holding them over long periods of time. How many people do you know who bought AAPL 0.00%↑ after the iPhone reveal and are still holding them? How many are still holding AMZN 0.00%↑ from their IPO, especially after the excruciating >90% drop in the early 2000s?
Investing is a mental game, much more than it is an analytical one. There is a good reason why I repeatedly refer to Mr. Market in my writings. To me, Mr. Market is a devil sitting somewhere in hell below me, constantly trying to deceive me into making the wrong choice. Believe it or not, after I doubled down in early January during my darkest hours when I questioned everything, I deleted my IBKR app from my phone to protect me from myself and because I couldn’t bear it anymore. Since then, I didn’t check the balance sometimes for weeks at a time.
For big winners, it’s always about seducing (in pumps) or scaring (in dumps) investors to sell. After all, eventually there will only be a small number of shares available to participate in the company. It is a natural process to weed out those who are not worthy. Stating it in a cultist way like this almost sounds ridiculous I know, but I don’t have a better way to articulate that. Repeating bull flags and breakouts is by far the best way to accomplish this weeding. You can see such a pattern not just in Tesla, but also in other high-performing hyper scarce assets.
Mechanical
It’s nice to have such a philosophical framework, but it’s better come up with some tangible support. I believe the big picture outlined above can be directly observed in investor behavior. And there is one place where that behavior culminates and everything comes together: The option chain.
What follows is quite technical, so I want to give you the conclusion and a summary upfront: S&P investors usually sell calls and buy puts. Market makers (MMs) mirror these trades and delta hedge them in the underlying. The result is that volatility is suppressed on the way up and amplified on the way down.
Tesla investors usually do the opposite. They buy calls and sell puts. MMs hedge this and volatility is amplified on the way up and suppressed it on the way down.
The chart below illustrates these two statements by plotting the average up-day minus the average down-day on a 3y rolling basis. It’s positive for Tesla which indicates that up-days are more violent than down-days. And it’s negative for the S&P indicating that down-days are more violent than up-days.
Recently, this has come down hard for Tesla, which suggests that there is either
less demand for long calls and short puts or
more demand for short calls and long puts.
Can we make this statement more precise?
There are some data providers that attempt to measure these things. They record for example whether certain trades happen at bid or ask which indicates the side the MM has taken. Or they follow the regulatory filings of MMs which informs us about their delta exposure. But the truth is: We do not know for sure how investors and MMs are positioned. And we also don’t know for sure how those option positions interact with their overall portfolio. A bunch of short puts in investor hands is uncritical if those are cash secured. But once they are naked, they become nuclear weapons for fellow bagholders. (Koguan Leo cough cough)
All in all, it’s a somewhat of a black box.
But there is an important clue: Implied Volatility.
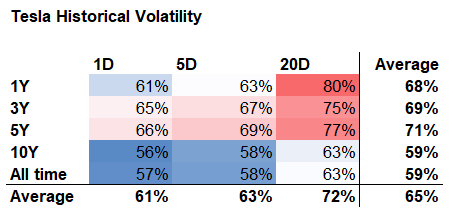
Tesla’s IV is currently 50-55% (depending where and how you measure it). This is true for both short-term options and also for LEAPS. And it is quite low, both compared to historical IV (62% on average over the past year) and compared to historical realized volatility. No matter how you slice it, Tesla’s historical realized volatility is close to 60% or higher.
It is highly unusual for IV to be lower than historical volatility. Typically, underwriters are compensated with higher IV to compensate them for agreeing to a skewed payoff profile. In a more general sense, they provide liquidity to markets by committing to selling into pumps or buying into dumps. Cash secured puts and covered call writing on the S&P has historically provided returns comparable to buy and hold.
There can be two reasons for IV being low. Either the reason for it being high is gone or there is now less demand for long options. I don’t think we have many reasons to believe that Tesla’s volatility is now lower than it has been in the past. The last year (even the last month) has been one of the most manic on record.
So, demand for long options has likely vanished. If my reasoning above is true, then a drop in demand for long calls is the main driver. In fact, I believe it is possible that net demand might actually have flipped from long calls to short calls. My view might be distorted due to the bubble I live in on social media. But my general perception is that investors have been frustrated by the volatile sideways trading range over the past two years. Why not heal some of that misery by monetizing some of the Tesla shares into covered calls.
What is happening right now is in my opinion a (covered) short call burn. And I believe that the next stage of the rocket will be fired up when long call demand returns.
And now, let’s dive into the options mechanics to support my statements above.


