
RKT 2Q23: Shaking off the mortgage rate shock
Stock has sneakily decoupled from nosebleed mortgage rates. This may be the signal needed to justify a contrarian bet on the true first mover fintech player in the US.

Today, Rocket Companies RKT 0.00%↑ published their 2Q23 earnings, which were solid given the challenging environment. $1.24bn in revenues handily beat $958m consensus. Non-GAAP EPS was slightly ahead ($-0.02 vs. $-0.05).
This company is a curious case. Depending on the year, they originate up to 10% of all mortgages issued in the US. Their market cap is $20bn. If they were in the S&P, they would handily be in the top 300. Yet, when I publish research on them, I could not get any less traction.
Investors don’t want to touch this with a 10 feet pole. And why would they? Home sales activity is dead due to prohibitively high mortgage rates and only God knows when that will be resolved. Existing home sales are chilling at levels last seen during the Covid crash and the Global Financial Crisis.

Many American mortgage debtors are locked into 30-Year terms after they took advantage of ultralow rates in 20/21. Nobody wants to move or refinance.
The vultures have identified their prey. Rocket’s short interest is 23% of the float. More importantly, that is 12 (!) days to cover given abysmal trading volume. That's way higher than other hated stocks. For example, CVNA 0.00%↑ is at 2 days to cover. AMC 0.00%↑ is 4 days.

Interest in this company is at rock(et) bottom. I believe this sets up an attractive contrarian opportunity here. In this article, I’m going to explain why. I attached my valuation model for premium subscribers. For free subscribers, I have attached the most important excerpts as screenshots throughout.
Investment Thesis Summary
Rocket originates and services mortgages, primarily in the US. They have built out a superior technology suite that enables them to acquire and retain customers cheaper than their peers. As a result, they have been able to outspend their competitors on marketing which has led to substantial market share gains over time.
The true beauty of their business model is what I call inflationary disruption. Their top line is a function of originated mortgage volume which is a function of home prices which are a function of monetary debasement.
Typically, technological disruption is based on deflationary drivers. A new product or service needs to be cheaper than the existing solution to win in the market place. Amazon revolutionized shopping by making it cheaper. Google revolutionized information collection by making it cheaper. This means that innovators are usually in a race against deflation. In terms of value-add, Google needs to permanently outrun the deflation in their revenue by click.
There are some exceptions to this rule, which I call the Inflationary Disruptors. Companies like Apple or AirBnB that disrupt an industry, taking market share and expanding the total market while at the same time benefiting from inflationary pressures on their products. Rocket is similar. They are a technological leader in a market niche that benefits from inflation as real estate appreciation drives up the mortgage volume of which RKT gets a constant cut. For more details, please check out my original deep dive from last year:

That article also explains their revenue and profit recognition in great detail which is crucial for understanding their financial statements.
Admittedly, the idea of monetary debasement driven real estate appreciation has taken a huge hit over the past year. And Rocket stock with it. But in my opinion, therein lies the opportunity. Look at the chart below, which plots Rocket stock against US mortgage rates (shown with an inverted scale).

As mortgage rates spiked to unimaginable levels over the past year, Rocket stock has plummeted with it. But the stock has recently shown some signs of life as it has somewhat decoupled from mortgage rates. The 30-Year fixed rate average mortgage rate hit 7% for the first time in October 2022 when Rocket stock marked its all time low of ~$6. Mortgage rates have not improved much since then. But Rocket stock is now trading 70% higher at ~$10. In my opinion, there is signal in this strength against the key driver for their misery over the past year.
I believe markets are currently in the process of shaking off the correlation with mortgage rates. They are looking past current macro headwinds into the company’s promising future. This is not an unprofitable shitco with a debt problem after all. It’s a very well managed business. The true first mover fintech in the US that has been operating for almost four decades.
Whether mortgage rates come down or not, the residential real estate market will have to wake up eventually. From a seller perspective, the three Ds (Debt, Divorce, Death) will always provide supply.
And from a buyer perspective, the US are currently in the middle of a period of elevated demand for homeownership as the Millennials, the largest generation ever, are currently in the family foundation phase. Do you think they all got their mortgage needs sorted out in 2020 and 2021? I doubt it.

Of course, Rocket’s operating performance is not just a function of whether there are transactions, but also at what level those happen. And home prices are suffering as the global economy is currently starving from a shortage of Dollar liquidity. But eventually, this liquidity will have to return. And while it might not reignite consumer inflation, it will very likely reignite asset price inflation. Scarce assets like real estate will likely be among the first to benefit from that.

I have made additional bullish points about housing prices in the article below. Admittedly, these have not aged supremely well so far, but the jury is still out on this call.

I sense that we are at a cyclical turning point which makes Rocket an attractive contrarian bet. To make a move here with conviction, it is crucial to develop a valuation view. How far can this run?
For this purpose, I have updated and refined my valuation model from last year.
Valuation Update
A cyclical company like Rocket is very difficult to value because we never really know where we are in the cycle. In addition to that, their income statement is notoriously difficult to read due to their corporate structure and most importantly their non-cash revenues. When they sell a mortgage and retain the right to service it, they are booking the entire present value of the mortgage servicing right (“MSR”) as revenue upfront. This frontloads their revenue and earnings recognition and blows up its margin in years with heavy origination volume.
From an analyst perspective, I don’t like this at all. That is why my model attempts to quantify the company’s sustainable mid-cycle cash revenue and cash earnings. To understand that in more detail, please revisit the my original report. The tables and charts below are excerpts from my valuation model which I have attached for premium subscribers.
Gain on sale of loans
Rocket’s bread and butter business is to originate mortgages and sell those to financial institutions. The mortgage volume is a function of the sale of new homes, existing homes and refinancing activities. My top down estimate for Rocket’s sustainable annual volume is $267bn. For reference, they did $133bn in 2022 and $351bn in 2021.

Rocket books revenues the moment they sell off these originated mortgages for a profit. The premium on top of the principal depends on a number of factors, incl. for example how much investor appetite there is for these assets. I believe that residential mortgages will remain to be a very attractive asset class for institutional investors because debtor quality is outstanding. The balance sheet of private households in the US is very strong. I have written in detail about that before in the articles below.


There is another problem here that matters more: Timing. A month or more can easily pass from the moment Rocket originates the mortgage to the moment they sell it to an investor. If mortgage rates increase during that period, they will have to sell the mortgage at a discount. The chart below illustrates the inverse correlation between mortgage rates and gain on sale of mortgages over the past 18 quarters.
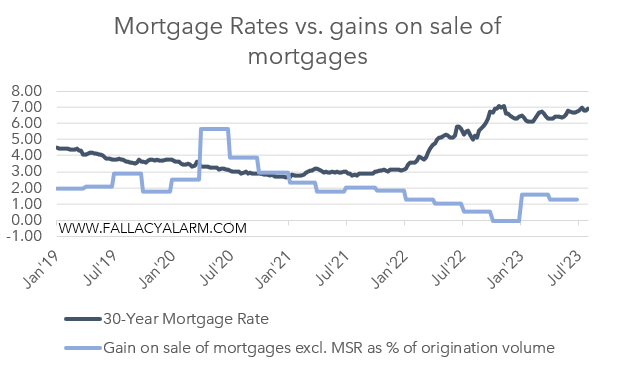
This chart suggests that they are typically able to earn 2-3% premium on the mortgage principal as long as mortgage rates are stable. Assuming that they can sustainably maintain a 2.5% brokerage cut, this will generate $6.7bn in revenues for them.

Servicing fee income, net interest income and other income
Rocket also services some of the mortgages they have originated and sold off. My model assumes that they will continue to service $500bn worth of mortgages for a 0.3% fee which should generate $1.5bn annually in revenues. This is by and large in line with their servicing fee income over the past year which has been steadily growing over time.
Net interest income is what they earn on the mortgages while they have them on their book before selling them, partially offset by the interest paid on their funding facilities. My model assumes that they will earn $200m annually on this which is also by and large in line with their historical performance.
Lastly, I’m projecting an additional $900m in other income for title insurance, property valuations and other services. It’s a highly cyclical business and I chose this to be conservative. For reference, this was $873m in 2022 and $1.6bn in 2021.

All in, this results in sustainable cash revenues of $9.2bn.
Margins
Rocket’s margins are highly cyclical, even when we look at cash revenues which are smoother than reported revenues. The company has decent operating leverage which makes the business very attractive in peak years.
The chart below illustrates this by regressing their quarterly cash revenues vs. their expenses for the last 18 quarters. The orange dot is the latest 2Q23 data point.

Both metrics correlate well for obvious reasons. But more importantly: the slope flattens with higher revenues. Above $3bn in quarterly revenues, expenses are not rising much further. You can interpret the regression equation in the chart above like this: Their quarterly base expenses are approximately $1.04bn and every additional $1 in revenues comes with $0.16 in costs. An incremental margin of 84%. Pretty wild, isn’t it?
An R-Squared of 52% is not great, but it’s solid enough to use this as the basis for deriving a sustainable margin level. I have used the regression equation in the chart below to illustrate the operating margin suggested for each quarterly revenue level:

$9.2bn in annual cash revenues would be $2.3bn each quarter, which comes with a 39% operating margin per the regression analysis. I have rounded this to 40% for my model.
Taxes
Rocket has a very funky corporate structure with Dan Gilbert owning a different share class than minority shareholders and they are doing some weird tax gymnastics. As a result of that, the company currently has an extremely low tax rate. To be honest, for an outside analyst it’s virtually impossible to fully comprehend what is going on. My assumption is that one way or another, Rocket will have to pay a federal and state income tax rate of 20% eventually which is in line with other public companies.
Valuation Result
Bringing it all together, I estimate the company’s sustainable mid-cycle net profit potential to be $3.0bn which equates to an EPS of $1.50.

I believe they could be assigned a premium P/E multiple to reflect their growth profile. They will likely continue to gain market share. But I doubt that markets will reflect that in the near to mid term due to its pronounced cyclicality and the suboptimal organizational structure. 15x should be doable though which would value the stock at $22.45, which equates to 125% upside.
Sincerely,
Your Fallacy Alarm
Model below.
